The Ministry of Education recently released the PGI for states and Union Territories for 2020-21. Today’s story looks at the details of this latest report including the movement of states across different levels.
The Performance Grading Index (PGI) is a tool to provide insights into the Indian school education system. One of the goals of the PGI is to offer information on the state of school education in States & UTs, including key levels that influence performance and important performance categories. It identifies the gaps and aids States/UTs in prioritising the intervention areas to make sure the school education system is strong at every level. It also intends to encourage States and UTs to implement multifaceted interventions that will result in the highly sought optimal educational results, while also encouraging them to adopt best practises.
One key feature of this index is the horizontal spread of this index, covering multiple areas of interventions that directly/indirectly influence the education system. The Ministry of Education recently released the PGI for states and Union Territories for 2020-21. Today’s story looks at the details of this latest report. Factly’s story on earlier editions of PGI can be accessed here.
The methodology behind PGI:
Before looking at the methodology, a few key aspects are to be noted. PGI is done at two levels- States & UTs, and Districts. This index does not use any primary data for its grading. It uses the existing secondary data from Unified District Information System for Education (UDISE), the National Achievement Survey (NAS) of NCERT, the Mid-Day Meal website, the Public Financial Management System (PFMS), and the Shagun portal.
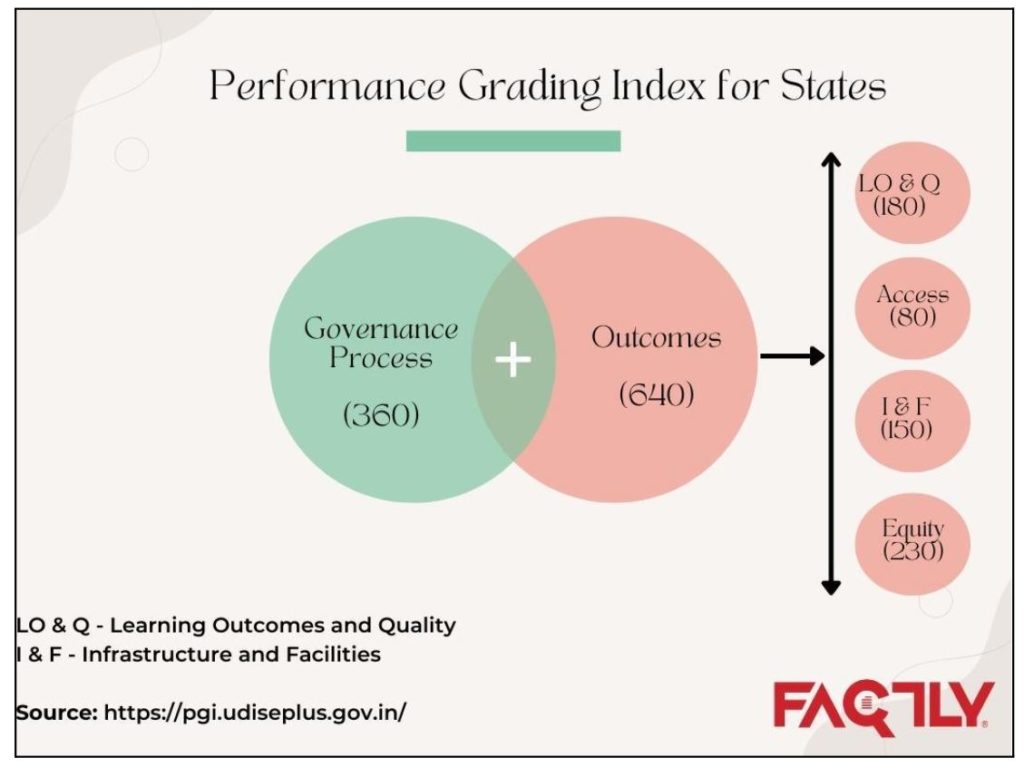
For state-level index, PGI is structured in two categories- Outcomes and Governance & Management. The outcomes category is further divided into domains such as learning outcomes and quality, access, infrastructure and facilities, and equity. The PGI follows a grading method, instead of ranking. It allows the states with the same performance to be at similar levels, without causing any stigma attached.
The latest released report also follows the same methodology as its previous editions. Since most of the data is self-reported by the states, any improvements may also be potentially due to improved data collecting and reporting systems.
Key Highlights- PGI state
States vs. PGI Grades
As stated earlier, the primary objective of the PGI is to bring transformational change by providing inputs on all the influencing factors of the school education system. It is a new index, that was launched in the year 2017-18. If we look at the performance of the states over these four years, incremental progress is observed.
The highest score in 2017–18 was Level IV (score range: 801–850), which improved to Level II in 2020–21 (score range: 901–950), indicating a steady improvement in the performance of States/UTs over the previous four years. In the years 2017–18 and 2018–19, no state achieved the top two levels (Level I and Level II), while in 2019-20, five states and in 2020–21, seven states achieved Level II. In contrast, 12 States/UTs fared below level VII in 2017–18, while no state has performed below Level VII in 2020–21, demonstrating a notable improvement in States/UTs over the past four years. No State figured in the bottom three levels in 2020-21 as against 2 States in the bottom three levels in 2019-20. The most notable performance in 2020–21 is Ladakh, which increased from Level 10 in 2019–20 to Level 4 in 2020–21. Despite this significant improvement, no state in these four years achieved the top-most grade, i.e., Level-1.
States’ performance over the years
It has to be noted that this improvement is not identical across the states. Some states saw a huge jump, while some remained at the same level. In comparison to none in 2017–18, a total of 7 States and UTs—Kerala, Punjab, Chandigarh, Maharashtra, Gujarat, Rajasthan, and Andhra Pradesh—have achieved Level II (scoring 901–950) in 2020–21. In PGI 2020–21, 12 States were graded as Level III (scoring 851–900), 6 States as Level IV (score 801–850), 6 States as Level V (score 751–800), 4 States as Level VI, and one State, Arunachal Pradesh, remained in Level VII (score 651–700). In total, 27 States and UTs have raised their overall PGI score from 2019–20 to 2020–21.
Inter-state differential
One of the main goals of PGI is to inform the States and UTs of the areas of improvement so that they can work to earn the greatest grade and score. Wherever they are graded, all States and UTs should try to advance to higher grades the next year. The inter-state disparity is calculated as the difference between the highest and the lowest-ranked states. The inter-state disparity in 2017-18 was almost three hundred, which rose above 300 points in 2018-19. For 2019-20, this difference jumped to 384, and for 2020-21, the difference dropped to 259, demonstrating a considerable improvement in the performance of the states at the bottom.
What caused these improvements?
While there has been considerable progress in the states’ rankings in PGI grades, it is also important to look at the areas of such improvement. As noted earlier, the grading is done for five domains – learning outcomes and quality, access, infrastructure and facilities, equity, and Governance Process.
Improvement in the Governance process is one of the significant factors contributing to a rise in PGI ratings, according to the domain-specific analysis. There has been a modest improvement in access for major states. Given that the data source is the same—the National Achievement Survey, 2017—the scores in the domains of learning outcomes and quality remained constant. All major states except Tamil Nadu did better at enhancing facilities and infrastructure with Chhattisgarh standing out as the top performer. Very few states improved equity, whiles states like Tamil Nadu, Telangana, Gujarat, Bihar, and Rajasthan showed a decline in equity provisioning.
Key Caveat
- The PGI report for 2020-21 still uses the data for Learning Outcomes (LO) from the National Achievement Survey 2017, which was conducted almost 3 years ago. Using the same old data could potentially negate any improvements made by the states over these four years.
In a welcoming move, the PGI Report for 2021–22 will be redesigned by adding new indicators to broaden the coverage without changing the total points to be consistent with NEP 2020 plans. Thus, the Index will give greater weight to domains like teachers, digital education, learning outcomes, etc., The updated PGI 2021–2022, would remove the obsolete and saturated indicators while the grading and marking procedure is expected to be more precise for future editions.

