The Performance Grading Index (PGI) provides insights into the working conditions of the school education system. The index covers multiple areas of interventions that directly/indirectly influence the education system. The Ministry of Education recently released the PGI for districts. Here is a deep dive.
Education is one of the important determinants of the prosperity of a nation. The system of education determines the extent to which the populace is equipped to deal with the ever-changing global challenges. It acts as the foundation, above which the rest of the structures lay. While developing an education system is one thing, its constant up-gradation and monitoring is another aspect, which is often ignored.
Indian Education system is one of the largest in the world, with over 250 million children, and 8.5 million teachers in more than 1.5 million schools. To deal with great diversity across different regions, this education system is stratified into various hierarchical levels, the epicentre being the Union Government. Both Union Government and State Governments have powers to make legislations on education. Several schemes have been initiated by both Union and State Governments for improving the access and quality of education. It, therefore, becomes of utmost importance to have clear monitoring standards to enable the efficient and smooth performance of the education system in India.
The Performance Grading Index (PGI) is one such tool that provides insights into the working conditions of the school education system. It is touted as the key tool to enable transformational change in the education system. One highlight of this index is the horizontal spread of this index, covering multiple areas of interventions that directly/indirectly influence the education system. The Ministry of Education recently released the PGI for districts. Today’s story looks at the details of the index, and the various trends.
Methodology behind PGI
PGI is done at two levels- States and Districts. This index does not use any primary data for its grading. It uses the existing secondary data from Unified District Information System for Education (UDISE), the National Achievement Survey (NAS) of NCERT, the Mid-Day Meal website, the Public Financial Management System (PFMS), and the Shagun portal.
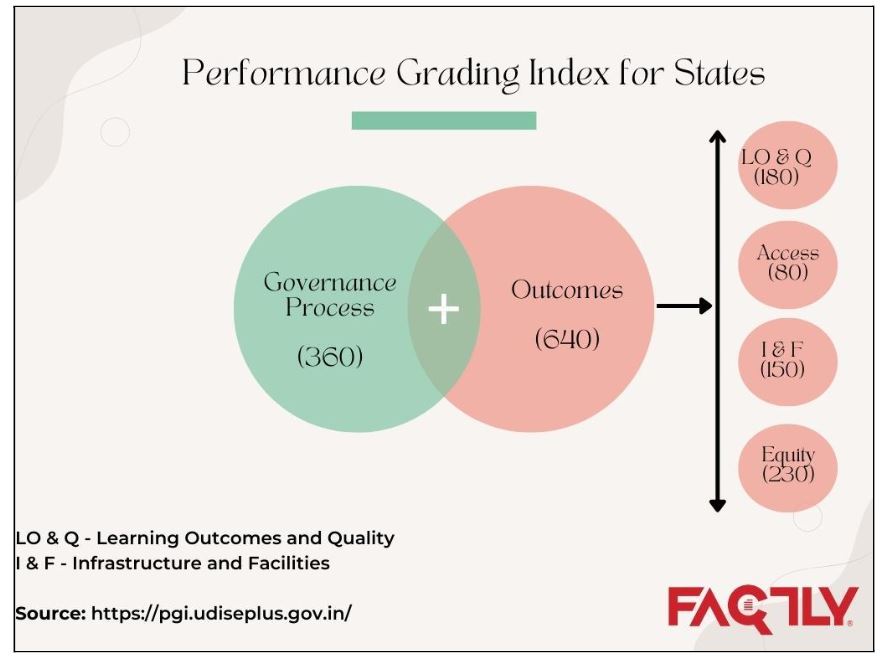
For state-level index, PGI is structured in two categories- Outcomes, and Governance & Management. The outcomes category is further divided into domains such as learning outcomes and quality, access, infrastructure and facilities, and equity. The cumulative weightage is for 1000, out of which the Governance process counts for 360, while the Outcomes comprise of 640 points. Out of this 640, learning outcomes and quality is given 180, access is given 80, infrastructure and facilities hold 150, and equity is given 230 points.
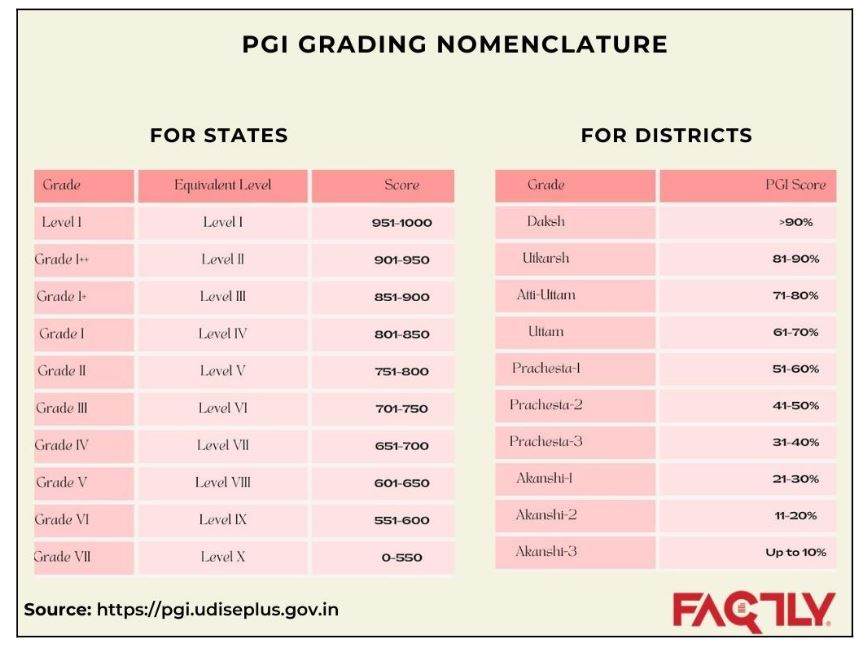
The PGI follows a grading method, instead of ranking. It allows the states with the same performance to be at similar levels, without causing any stigma attached. The Grading index followed for states is as below.
For the districts, this index is slightly tweaked. The total weightage is 600 points, divided into 6 categories – Outcomes (290), Effective Classroom Transaction (90), Infrastructure Facilities & Student’s entitlements (51), School Safety & Child Protection (35), Digital Learning (50), and Governance Process (84). The index has given more than 60% weightage to qualitative indicators. The grade-wise nomenclature for states and districts is as below.
Key Highlights- PGI state
States vs. PGI Grades
As stated earlier, the primary objective of the PGI is to bring transformational change to the school education system. It is a relatively new index, starting from the year 2017-18. So far, three reports have been published. If we look at the performance of the states over these three years, an incremental transformation can be seen quite clearly. In 2017-18, only three states scored above 800. In 2018-19, this increased to five states, and in 2019-20, nearly twenty states/UTs have scored more than 800. The concentration of states in 2017-18 was highest in Grade III to Grade V bracket, while in 2018-19, Grade II to Grade III had the highest concentration. In 2019-20, Grade I++ to Grade II had the highest presence of states/UTs. This represents a clear improvement in the performance of states. However, no state in these three years achieved the top-most grade, i.e., Level-1.
States’ performance over the years
It is observed that the performance of the states improved over the last three years. However, this improvement is not uniform across the states. Some states saw a huge jump, while some remained at the same level. States like Uttar Pradesh, and West Bengal improved from Level VIII in 2017-18 to Level IV in 2019-20, and Maharashtra rose from Level VII to Level III during the same period. Madhya Pradesh remained at Level VII during the same period. States like Telangana, Bihar, Kerala, Himachal Pradesh, and Rajasthan improved marginally. The State of Chhattisgarh is the only one to fall in Grades from Level VI to Level VII during these three years. Ladakh’s performance also fell from Level VI in 2018-19 to Level X in 2019-20.
What caused these improvements?
While there has been considerable improvement in the states’ position in PGI grades, it is also important to look at the reasons behind such improvement. As noted earlier, the grading is done for five domains – learning outcomes and quality, access, infrastructure and facilities, equity, and Governance Process. The top and least performers (Change in scores from 2019-20 to 2017-18 report) excluding northeastern states and UTs, in each domain is as follows
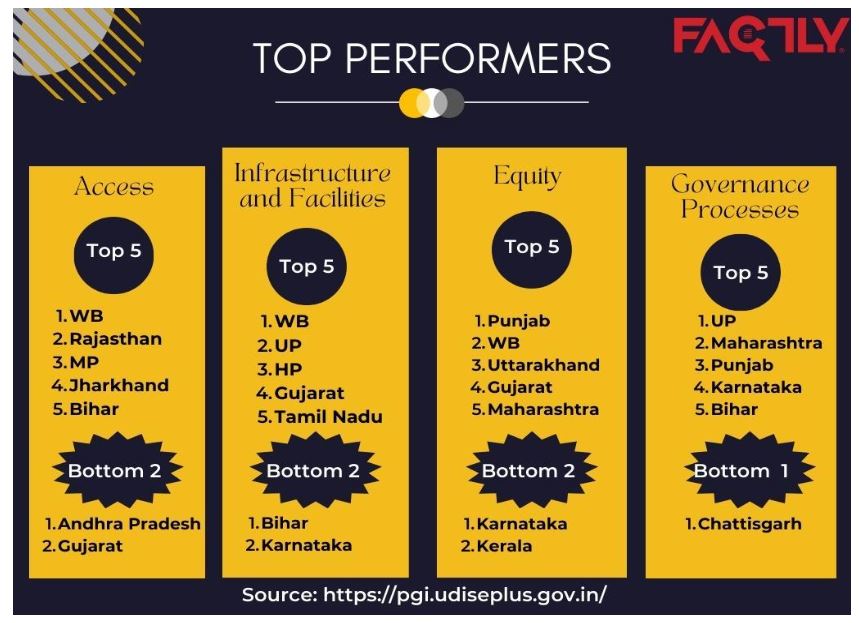
The domain-specific analysis points out that improvement in the Governance process is one of the important factors leading to a jump in PGI scores. The improvement in access for all states is very minimal. The scores in Learning Outcomes and Quality domain remained the same since the source of data is the same, i.e., National Achievement Survey, 2017. Some states performed better in improving infrastructure and facilities. Very few states performed in enhancing equity. Below is the distribution of top states for which scores have improved, and states for which scores have decreased from the 2017-18 level. These improvements could also be due to the improved data collection and reporting mechanisms since most of the data is self-reported by the states.
Key Highlights- PGI districts
Districts vs. PGI Grades
The Performance Grading Index for districts is a relatively new addition, with only two years of data being available. In 2018-19, around 725 districts were ranked, whereas in 2019-20, eight new districts were added, taking the total count to 733. The comparison of gradings from these two years indicates an improvement in the performance of the district. In 2018-19, no district was in the Utkarsh grade, while this has increased to 3 in 2019-20. Similarly, the number of districts in Atti-Uttam grade increased from 49 to 86, and in Uttam grade from 267 to 276 in 2019-20. Note that no district was categorized under the top grade. ‘Daksh’ in either of these years.
Domain wise PGI District Score Card
Insights for a future action plan are provided by the domain-by-category analysis, which highlights areas of strong practices and weak ties among districts. Domain-specific grade card also gives a hint about how the districts are placed with respect to each domain. In the Outcomes domain, around 343 districts had improvement in their scores, while in the Effective Classroom Transactions (ECT) domain, nearly 510 districts have improved. In the Infrastructure, Facilities, Student Entitlements (IF & SE), 478 districts improved, while in School Safety and Child Protection (SS &CP), 125 districts performed better. In the recently added Digital Learning (DL) domain, 63 districts have improved, while in the Governance process, 103 districts have improved in their scores.
As for the concentration of districts in different grades, in the outcomes domain, the majority of the districts are concentrated in the Prachesta-1 and Prachesta-2 grades, while in the ECT domain, the major concentration is in the Utkarsh and Atti-Uttam grades. Similarly, for IF & SE domain, Utkarsh, Uttam, and Atti-Uttam have more concentration, while for School Safety and Child Protection, Daksh and Uttam have more districts. In the digital learning domain, the concentration of districts is higher towards the least side of the grading – Akanshi-1,2 &3. In the Governance process, the concentration is distributed among the top four grade levels.
A considerable improvement is necessary for outcomes and digital learning domains for a majority of the districts to perform better in the upcoming ranking.
Some concerns
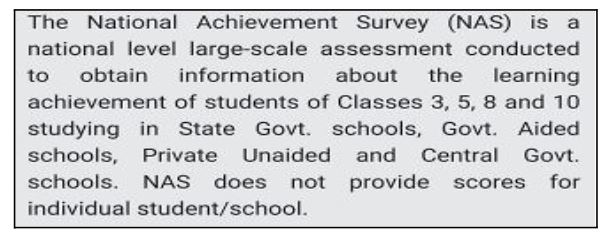
- As mentioned earlier, secondary data is used for the computation of this index. For the learning outcomes and quality domain, data from National Achievement Survey (NAS), 2017 is taken. It is a system-level assessment, summarizing the achievements at district, state, and national levels.
As can be seen from above, NAS includes private unaided schools also. For the PGI grading, data from NAS is selected. However, certain PGI indicator level data seeks data only from Government and aided schools.
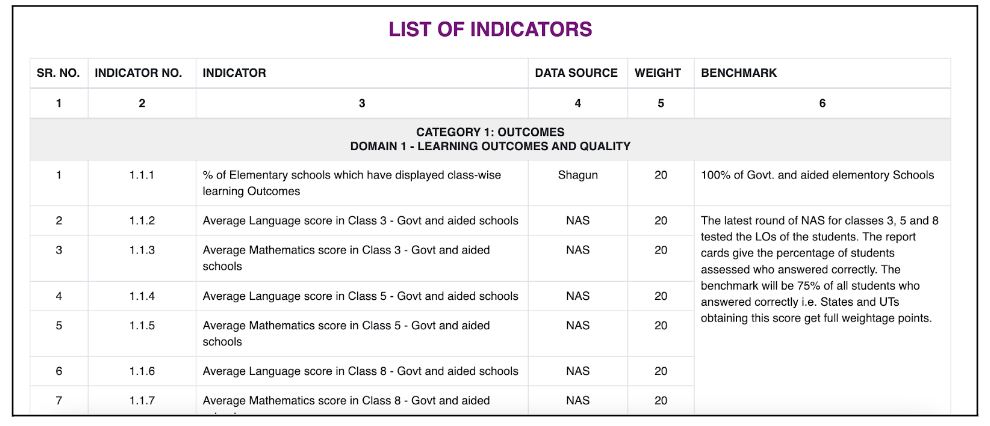
For the computation of these scores in PGI, whether only data from Government and aided schools are shortlisted and chosen from the NAS survey report, is not clear. If the data is directly dumped from the NAS, then the learning outcomes and quality scores in PGI could be misleading.
- Even though the same NAS 2017 data is used in both PGI 2017-18 and PGI 2019-20 reports, West Bengal showed a 20-point improvement, Bihar and Tripura showed a 12-point improvement, Odisha 4, Manipur 4, Jharkhand 2-point improvement respectively in the Learning Outcomes and Quality. Sikkim, Arunachal Pradesh, and Assam showed a reduction in their scores in this category. It is not clear how this divergence in the scoring is possible, given the fact that this is the NAS report officially reported by the NCERT.
- As can be seen, the governance process is given higher weightage than the learning outcomes and quality. The reasoning for the high weightage of this domain is due to the critical importance of these indicators in bringing structural reforms to the education system. While it is understandable that many states do not have a proper reporting mechanism, and it is important to ensure compliance with these, shifting our focus from learning outcomes and quality may lead to undesirable results. It is because Learning outcomes and quality changes are time-taking and require significant human and material resources. Leaving it for the future, in search of something else, would be detrimental and could nullify the effects of such rankings and indices. Like they say, ‘In search of gold, lost the diamond’ could well become true.
Featured Image: By Jagseer S Sidhu – Own work, [CC BY-SA 4.0]

