
In light of the recent Sri Lankan economic crisis, a social media post comparing the annual debt to GDP ratio of India with that of Sri Lanka is being widely circulated. The post claims that India’s debt to GDP ratio figures is in line with that of Sri Lanka and that a similar economic crisis awaits India. Through this article let’s fact-check the claim made in the post.
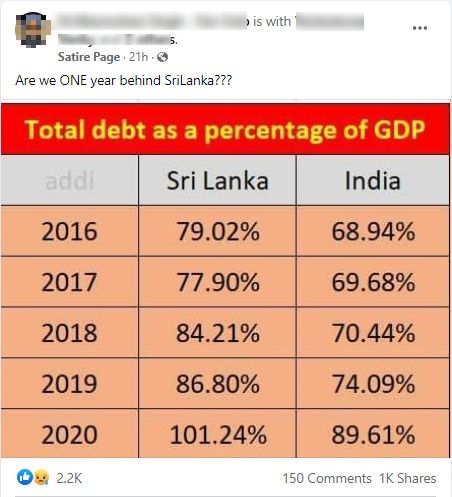
Claim: India’s debt to GDP ratio figures is in line with that of Sri Lanka.
Fact: While it is true that Sri Lanka’s total debt as a percentage of GDP is high and even surpassed 100%, India’s total national debt as a percentage of GDP figures is not as high as claimed in the post. From 2016-17 to 2020-21 India’s overall national debt as a percentage of GDP is hovering around 50%. Although the debt position of the nation is much lower than the claim made in the post, if we include the debt of all the states, the debt position is in line with the claim. Hence the claim made in the post is MISLEADING.
Sri Lanka is facing its worst-ever economic crisis; experts opined that debt management of the country is also a reason for the dire state of the country’s economy. Reviewing Sri Lanka’s economy last month IMF said that ‘public debt had risen to “unsustainable levels” and foreign exchange reserves were insufficient for near-term debt payments.’
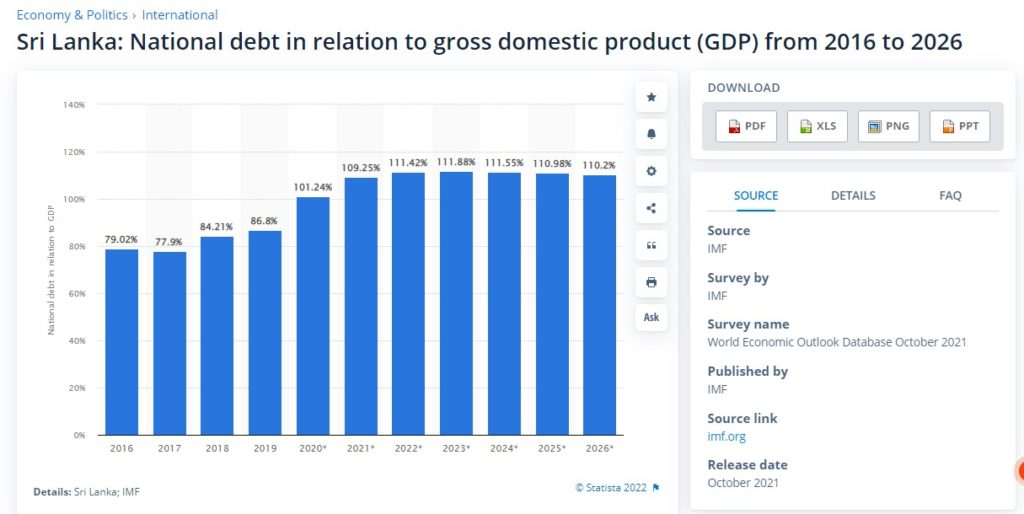
According to the data available on IMF, Sri Lanka’s gross debt as a percentage of GDP accounted for 79.02% in 2016 and this has risen to 111.42% in 2022. This implies what the country owes is more than what it produces.
Another major issue with Sri Lanka is that the foreign debt (external debt) is almost the same as domestic debt (internal debt).
The information regarding Sri Lanka’s debt position as provided in the post is true. However, the actual figures for India’s debt as a percentage of GDP are significantly lower than the claim made in the viral post.
According to the information related to the debt position of India, available on the RBI website, from 2016-17 to 2020-21, the country’s overall national debt as a percentage of GDP is hovering around 50%. Total debt comprises both external as well as internal debts and also accounts for other liabilities.
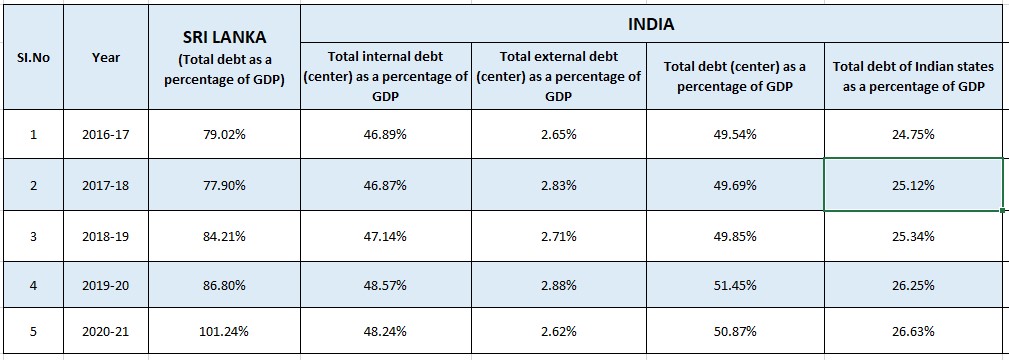
Likewise, India’s total internal debt (debts raised through internal sources) as a percentage of GDP is less than 50%. From 46.89% in 2016-17, the total internal debt as a percentage of GDP saw a marginal increase to 48.24 in 2020-21.
Unlike in the case of Sri Lanka where half the debt is foreign (external), the total external liabilities (debt borrowed from external sources) as a percentage of GDP in the case of India is a little under 3%, significantly lower than for Sri Lanka.
What if the Debt of States is included?
When the outstanding debt of all the states is included, India’s total debt as a percentage of GDP (both centre and the states are combined), except for the year 2020-21, is in line with the figures claimed in the viral post. Most likely, the figures claimed in the post could be sourced from this statistic.
To sum it up, India’s total national debt as a percentage of GDP is not in line with that of Sri Lanka.
UPDATE (09 April 2022)
In the context of the Sri Lankan economic crisis, another post is going viral which claims that the Government of India took loans worth Rs. 55 lakh crores in the first 67 years after India’s independence while the Narendra Modi led BJP government took loans worth Rs. 73 lakh crores in just 8 years.

Claim: Government of India took loans worth Rs. 55 lakh crores in the first 67 years after India’s independence while the Narendra Modi led BJP government took loans worth Rs. 73 lakh crores in just 8 years.
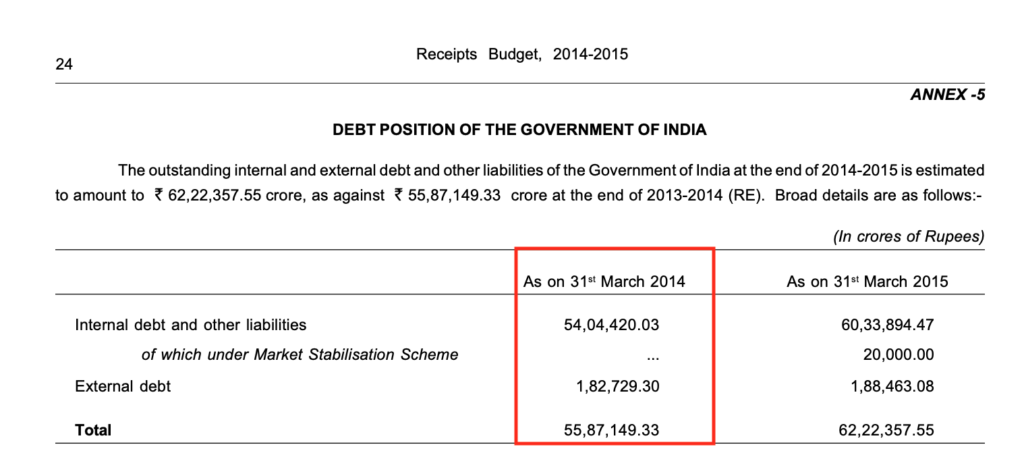
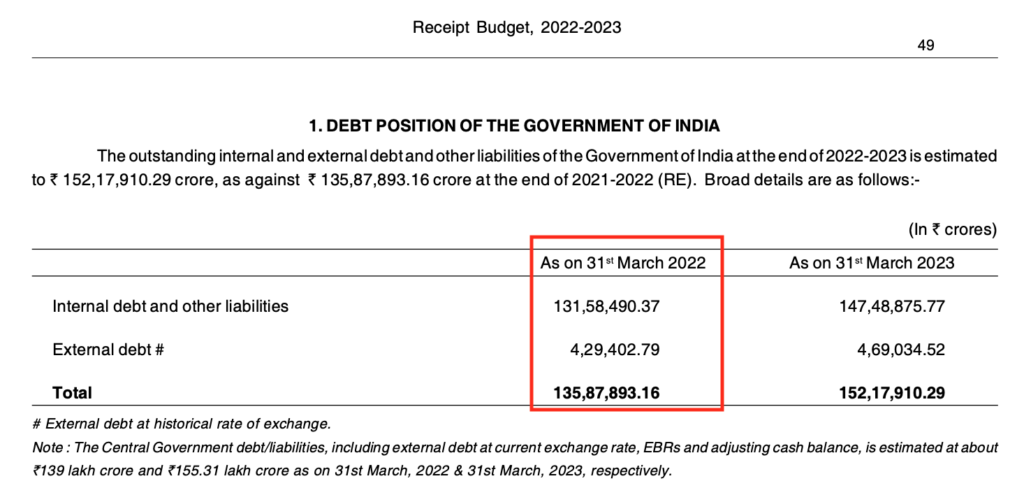
Fact: It is true that the total outstanding liabilities of Government of India by 31 March 2014, were Rs. 55.87 lakh crores. However, this is not the total amount of loans availed in the 67 years but outstanding amount by that date. By 31 March 2022, the total outstanding liabilities of Government of India are estimated at Rs. 135.87 lakh crores. However, the ‘Debt to GDP Ratio’ of the Government of India was 52.16 by the end of 2013-14 which is expected to be in the same range even by the end of 2021-22. Hence the claim made in the post is MISLEADING.
As per official budget documents, it is true that the total outstanding liabilities of the Government of India by 31 March 2014, were Rs. 55.87 lakh crores. However, this is not the total amount of loans availed in the 67 years but the outstanding amount by that date. The ‘Debt to GDP Ratio’ of the Government of India was 52.16 by the end of 2013-14 as per Reserve Bank of India (RBI) data.
By 31 March 2022, the total outstanding liabilities of the Government of India are estimated at Rs. 135.87 lakh crores. However, the ‘Debt to GDP Ratio’ of the Government of India which was 52.16 by the end of 2013-14 is expected to be in the same range even by the end of 2021-22.
To sum it up, while the figures related to the total outstanding debt are true, the ‘Debt to GDP Ratio’ is not going to change significantly.

