Starting today, we are launching this new fortnightly series called the ‘Government Data Roundup’. This fortnightly roundup brings you a compilation of the data released by the government during those two weeks with information about the type of the data, the sector to which the data relates, the frequency of release, and a brief about the data. Here is the first edition.
‘What gets measured, gets managed’. This quote highlights the importance of data collection for bringing any sort of change. Data is an important part of this new-age digital society.
The Government is the single largest source of data, both in the public as well as private sectors. It periodically publishes various data in the form of reports, surveys, and indices. Most often, these publications either go unnoticed or get minimal attention. As a result, many tend to be clueless about the latest happenings in the country. To better equip people with information about the government data, this new fortnightly roundup brings you a compilation of the data released by the government. Information about the type of the data, the sector to which the data relates, the frequency of release, the agency responsible for the publication, and the source link of the data is provided in this roundup.
Information about each data release is divided into three sections:
- Brief about the data release
- Key highlights
- Significance of the data or What that data means to you
The sectoral division is not entirely rigid and depends on the type of data released. However, the overarching objective is to provide users with comprehensive information about each source.
In the brief about the data, information about the objective behind the publication of such data is provided. Additionally, insights about the data sources, the method of data collection, and things to be mindful of are also mentioned. In the next section, i.e., key highlights, and important statistics regarding the data are presented. This section provides the takeaways from the data released. The final section deals with how the released data is significant and the ways in which it could impact us, the people. Not all data could be directly relevant to the people, but every piece of data has some significance for the larger public. This roundup strives to add value to each data release from that perspective.
This edition of the Government data roundup consists of reports about the Government debt, the National Time Release Study, the State energy and climate index, RBI’s forward-looking surveys, index of industrial production, Consumer price index, and wholesale price index.
| Report name | Status Paper on Government Debt |
| Sector | Finance |
| Agency responsible | Public Debt Management Cell, Ministry of Finance |
| Frequency of release | Annual |
| Source Link | Status Paper on Government Debt |
Brief about the report/data:
This report presents a detailed picture of the country’s overall debt position. It is a go-to document to find all the related information about Government’s debt. Public debt is categorized into internal and external debt. Internal debt is further classified into marketable and non-marketable debt.
This report also consists of a debt management strategy (DMS), whose objective is to ensure that the financing of debt is made at the least possible cost, keeping in mind the degree of risk associated.
Key Highlights:
- Net liabilities of the Union Government as a percentage of GDP rose from 49.1% to 59.2% from March 2020 to March 2021.
- Within this, the sovereign external debt consisted of only 5.3%, while the rest is in domestic currency denomination, indicating a low currency risk.
- The marketable debt share in internal debt had declined from 81.8% in March 2020 to 79.3% in March 2021.
- The Average interest cost (AIC) is below the nominal GDP growth rate, demonstrating the comfortable situation of India in terms of sustainability of debt.
What Government debt could mean to you:
- Excess government debt can destabilize the entire economy, with consequences ranging from currency strength to employment conditions. A significant external debt could also lead to a balance of payments crisis, as is happening in Sri Lanka these days. India’s external debt is only 5.3% of the GDP.
- The underlying desirability to use the debt approach to influence the economy and its effects on the future should be evaluated on a timely basis by independent agencies since those in politics are usually inclined to raise debts instead of taxes.
| Report name | State Energy and Climate Index |
| Sector | Energy |
| Agency responsible | NITI Aayog |
| Frequency of release | Annual |
| Source Link | State Energy and Climate Index |
Brief about the report:
This report is the first of its kind that tracks the efforts made by the governments in the climate and energy sector. The report is divided into three thematic parts each dealing with distinct aspects of the sector. The first part deals with the objective and the current energy scenario in the country. The second part deals with the methodology aspects and the ranking of states/UTs based on the scores in the index. The last part looks at the key learnings and the recommendations for the future.
It has 27 indicators under 6 parameters – DISCOM’s performance (40%), Clean Energy Initiatives (15%), Access, Affordability, and Reliability of Energy (15%), Environmental Sustainability (12%), New Initiatives (12%) and Energy Efficiency (6%). The percentage in the parentheses indicates weightage out of 100%.
Key Highlights:
- The report categorizes the performances of the states into three broad categories based on their scores – States with scores >=46 are put under ‘Front-runners’, those with scores from 36 to 46 are ‘achievers’ and those below 36 are ‘Aspirants’.
- Gujarat topped the list, followed by Kerala and Punjab among the larger states. Rajasthan, Jharkhand, Madhya Pradesh, and Chhattisgarh were placed under the ‘Aspirants’ category.
- Among the smaller states, Goa stood first, followed by Tripura. The rest of the states fell in the ‘Aspirants’ category. Among the Union Territories, Chandigarh and Delhi topped the list, while Lakshadweep fell last.
- Among all the parameters, ‘DISCOMs performance’ was the highest-scoring parameter, while ‘New initiatives’ were the least scoring parameter.
Significance:
- The role of states in ensuring energy security as well as seamless energy transition towards renewables is critical for the country’s overall ambitions.
- Cooperation and competition among states are also critical to the country’s journey to a green economy.
| Report name | National Time Release Study |
| Sector | Customs |
| Agency responsible | Central Board of Indirect Taxes and Customs |
| Frequency of release | Annual |
| Source Link | National Time Release Study 2022 |
Brief about the study:
Time Release Study is a performance measurement tool, as recommended by the World Trade Organization (WTO), to gauge the process of cargo clearance of international trade. It measures the average cargo release time – the total time taken from the cargo arrival till the release for import or export.
The study looked at 15 distinct types of custom formations – seaports, inland container depots (ICDs), air cargo complexes (ACC), and integrated check posts (ICPs). The study is conducted to review progress in achieving the targets of the National Trade Facilitation Action Plan (NTFAP).
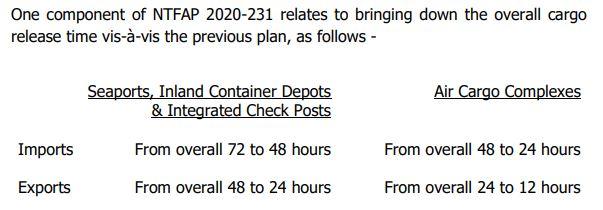
Key highlights:
- The ICPs have achieved the set targets under NTFAP, while the other three have reached three-fourth of their targets.
- Four-fold ‘path to promptness’:
- Advance filing of import documents to enable processing at the pre-arrival stage.
- Risk-based facilitation of cargo.
- Direct port delivery (DPD) facility
- Trusted client program benefits- Authorized economic operators.
Significance:
- Improves India’s ranking in Ease of Doing Business (EODB).
- It Benefits Indian export-oriented enterprises by standardising the processes with international standards.
| Report name | Consumer Confidence Survey |
| Sector | Economy |
| Agency responsible | RBI |
| Frequency of release | Bi-monthly |
| Source Link | Consumer Confidence Survey |
Brief about the survey:
The consumer confidence survey (CCS) is an exercise to measure the current perceptions with respect to the previous year while also measuring the expectations for one year ahead on general economic conditions like spending, employment scenario, the economic situation in general, and price situation, etc. The data is collected from households in the major cities of India. Factly’s explainer on the ‘Consumer Confidence Survey’ can be read here.
Key Highlights:
- Both the current situation index (CSI) as well as future expectations index (FEI) are on a recovery path.

Significance of Survey:
- Measures the extent to which the public’s feelings are either negative or positive about the country’s economic situation.
- Positive feelings → increased demand → Production rises → Growth in the economic situation.
- Negative feelings → Low consumption → Decline in Production →Poor economic conditions.
- Consumer confidence is considered a proxy for household spending on consumption.
- This data is used by financial institutions to undertake necessary measures so that the health of the country’s economy is in good condition.
| Report name | Services and Infrastructure Outlook Survey |
| Sector | Economy |
| Agency responsible | RBI |
| Frequency of release | Quarterly |
| Source Link | Services and Infrastructure outlook survey |
Brief about the survey:
The Services and Infrastructure outlook survey portrays the expectations of Indian companies in the service and infrastructure sectors based on parameters relating to price situation, demand conditions, employment conditions, and similar other parameters. Around 574 companies were asked to provide their assessment for the fourth quarter Q4 of 2021-22 and expectations from Q1 of 2022-23.
Key Highlights:
- The service sector had shown less optimism about the existing business conditions during Q4 of 2021-22. Higher input costs were creating huge pressure, with a slight improvement in marginal selling price.
- The expectations for Q1 of 2022-23 were more optimistic in terms of the overall business situation. However, the cost burden is expected to remain at a higher level. The selling price and profit margin saw guarded optimism against the firms.
- The infrastructure sector expressed lower optimism, with employment conditions remaining subdued for Q4 of 2021-22.
- Like the service sector, the infrastructure firms expressed pressure from rising input prices. However, there was a guarded optimism about the availability of finance.
- The expectations for Q1 of 2022-23 of the infrastructure firms reveal that the demand parameters expand at a slower pace than expected.
- The firm expects low optimism about the increase in selling price as well as profit margin.
| Report name | Consumer Price Index (CPI) |
| Sector | Economy |
| Agency responsible | MoSPI |
| Frequency of release | Monthly |
| Source Link | Consumer Price Index |
Brief about the index:
CPI measures the changes in the price level of goods and services that are consumed in a household. It has a fixed basket of goods and services that includes Food and Beverages; Pan, tobacco, and intoxicants; clothing and footwear; housing; fuel and light, and miscellaneous. Each of these categories has weights assigned to them. Along with this, the Consumer Food Price Index (CFPI) is also measured, which is the change in prices of food products consumed by the population. The National Statistical Office (NSO) under the Ministry of Statistics and Programme implementation (MoSPI) is responsible for the release of the data. The base year had been changed from 2010 to 2012 from 2015 onwards and the data is collected from 1181 village markets and 1114 urban markets across the country. It is a Laspeyre’s index, which is calculated as CPI = (Total cost of a fixed basket of goods and services in a particular period*100)/ (Total cost of a fixed basket of goods & services in base period)
Key Highlights:
- The final CPI combined (Rural+ Urban) general rate stood at 6.07% for February-2022, while March-2022’s provisional combined stood at 6.95%. This marks an increase from March-2021’s combined rate of 5.52%.
- The combined CFPI for Feb-2022 stood at 5.85%, while the provisional CFPI for March-2022 stood at 7.68%. This shows a significant rise from the March-2021 figure of 4.87%.
Significance of the report:
- It has a fixed basket of goods and services that cover all items an average Indian household consumes. Therefore, it gives an indication of the general price of goods & services in the market and hence the cost of living.
- Since it talks about the consumption of household items, it can be a proxy for measuring the purchasing power of the currency.
- It measures the change in only prices, hence often considered a barometer of inflation.
- This index is used by institutions like the RBI and the government to adopt suitable strategies and policy measures. RBI has been using CPI as an anchor to monetary policy stance.
| Report name | Wholesale Price Index (WPI) |
| Sector | Economy |
| Agency responsible | Ministry of Commerce & Industry |
| Frequency of release | Monthly |
| Source Link | Wholesale Price Index |
Brief about the index:
It is an average change in the prices of wholesale commodities. The index basket comprises three categories – Primary Articles (117 items, 22.62% of total weight), fuel and power (16 items, 13.15% of total weight) and manufactured products (564 items, 64.23% of total weight). The weights accorded to each category are based on the value of production adjusted for net imports. The base year for this index is 2011-12. It is important to note that WPI does not include services. It focuses on the prices of goods that are traded between the organizations and not the goods brought by the consumers. WPI is also known as the ‘headline inflation rate’ in India.
Key Highlights:
- The provisional inflation for March-2022 stood at 14.55%, marking a huge increase from that of March-2021’s 7.89%.
- Such a rise in inflation is due to the disruptions in the global supply chain, caused by the ongoing Russia-Ukraine crisis.
Significance of the report:
- It gives an estimation of inflation at a wholesale level, providing an insight into the prevailing macroeconomic conditions in the country.
- Investors tend to rely on WPI for their business and investment decisions.
- WPI affects the fixed price markets as well as stock markets. It reflects the conditions of demand and supply in the market.
- A major proportion of WPI comprises manufactured goods, which in turn are dependent on the global conditions. Hence, changes in WPI do not always translate into changes in CPI.
- The WPI is also used as a deflator in several macroeconomic variables of the economy including in the estimation of the GDP of the country.
| Report name | Index of industrial production (IIP) |
| Sector | Economy |
| Agency responsible | MoSPI |
| Frequency of release | Monthly |
| Source Link | Index of Industrial Production |
Brief about the report:
This index measures the changes in the level of industrial production in a given economy. It indicates the mood of the industrial activity in the country. The base year for this index is 2011-12, and it is assigned a value of 100. While the annual survey of industries gives a complete and detailed picture of the industrial activity, this index gives a short-term analysis of the industrial performance. The data for this index is sourced from 14 different agencies like the Indian Bureau of Mines, coffee board, tea board, central electricity authority, and so on.
For the purpose of this index, industrial production is categorized into three sectors – Mining (14.2%), Manufacturing (75.5%), and Electricity (10.3%). The values in the brackets denote their relative weights. Alternatively, there is also a ‘use-based’ classification of goods – primary goods (34.05%), capital goods (8.22%), intermediate goods (17.22%), infrastructure goods (12.34%), consumer durables (12.84%), and consumer non-durables (15.33%).
Key highlights:
- The IIP for February 2021-22 stands at 132.1, which means that it has grown 32.1% compared to the base year. It was 129.9 during February 2020-21. Among the sectors, electricity topped with a score of 160.8, followed by manufacturing at 130.8 and mining at 123.2.
- According to the use-based classification, primary goods stood at 130.8, capital goods at 94.3, intermediate goods at 144.0, and infrastructure goods at 153.0. The indices for consumer non-durables stood at 139.5 and that of consumer durables was at 114.7.
- The majority of the goods have shown improvement over the February 2020-21 values, with consumer durables and non-durables registering a declined growth.
Significance:
- Stronger IIP leads to high production which in turn causes demand to increase, thereby improving sales and profits.
- Higher production often requires fresh investment, which in turn is financed by the banking sector thereby improving its lending.

