[orc]The RBI recently published the results of the September 2019 round of the Consumer Confidence Survey. But, what is the survey all about? What do the numbers indicate? Here is an explainer.
The Reserve Bank of India, on 04 October 2019, published the results of Consumer Confidence Survey of the September 2019 round. The survey revealed that consumer confidence had declined further as compared to the previous surveys. As a part of this survey, perceptions of people on economy, employment and other general relatable economic concepts which are confronted by households on a daily basis are recorded. Under the same headings, what respondents are anticipating in the next one year is also recorded.
But, what is the Consumer Confidence Survey? How is it carried out? What is its significance? This story elucidates the purpose of this quarterly survey, methodology involved, and sample used in the study. The recent trend in consumers’ confidence is also examined in this story.
What is the Consumer Confidence Survey? Why is it significant?
Consumer Confidence Survey is a quarterly survey conducted by the Reserve Bank of India (RBI) to ascertain how confident people are about the economy. It indicates how people perceive the economy to be and how, according to them, it will be in the following year, giving insight into the country’s economic prospects. The survey also reflects consumption patterns of consumers based on how much they spend. It is apparent that greater confidence amidst the respondents implies consumers are willing to spend more money and this might lead to positive economic growth. In case the consumers exhibit lower confidence, it is an indicator that consumers are not willing to spend and hence may indicate a slowdown in general. This is because consumers are apprehensive and think twice before spending their hard-earned money. Similar surveys are conducted in other countries as well with slight variations.
How is the survey carried out?
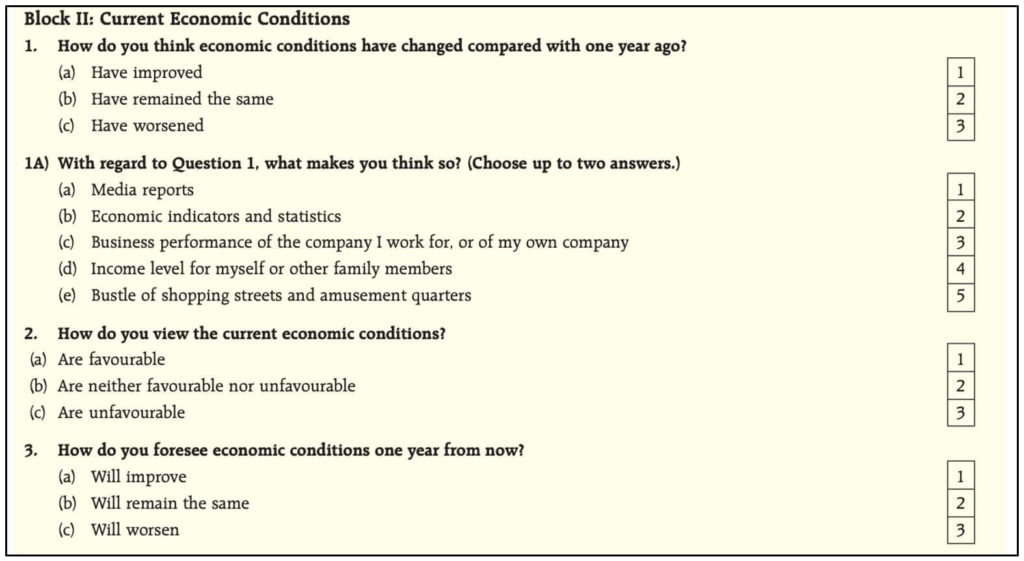
Earlier, only the six metropolitan cities in the country were given prominence in the survey. Each of these six cities – Bangalore, Chennai, Hyderabad, Kolkata, Mumbai and New Delhi, was divided into three major areas which were further subdivided into three sub areas. From each sub area, 100 urban households were selected randomly. Thus, we have 900 respondents from each city totalling to 5400 respondents across the six cities. Those responses which are suitable for further analysis are used to produce the results. Around 5000 records are analysed every three months. The questionnaire used for the survey is also published by the RBI.
Seven more cities are being covered in the survey since 2018
This survey has been regularly conducted by the RBI since June 2010. Since September 2017, the number of cities has been extended to thirteen. The new additions to the list are Ahmedabad, Bhopal, Guwahati, Jaipur, Lucknow, Patna and Thiruvananthapuram. The number of households surveyed in each city is proportionate to the number of households recorded in Census 2011. However, the total sample size has been maintained at 5400. The number of records analysed still revolves around 5000.
What are the factors that are taken into consideration in the survey?
Through the survey, qualitative information is captured. The questions covered in the survey are related to the respondent’s opinion on the economic situation, price levels and inflation, employment prospects, income and spending pattern. Since March 2015, questions pertaining to household circumstances such as assets, real estate, gold and motor vehicle were omitted from the schedule.
How is the assessment carried out and How is the index calculated?
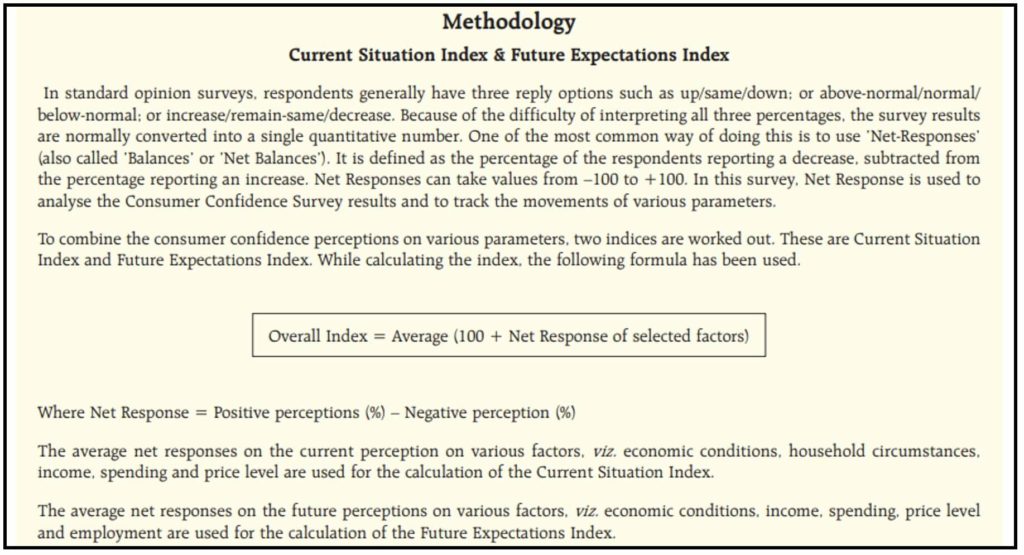
The assessment is carried out in two scales- perceptions and expectations. Perception is how the current situation is as compared to the previous year and expectation is what they are expecting it to be in the coming year. Responses are recorded on a three-point scale, whether the financial condition has/will improve, worsen or remain constant. Under each of this scale, number of respondents who had similar opinion is expressed as the percentage of total number respondents. Net responses, also termed as net balances, is arrived at by subtracting the percentage of respondents who reported a decrease from the percentage of respondents who reported an increase. Thus, it can take any value in the range -100 to +100.
Current Situation Index (CSI) and Future Expectation Index (FEI) are two indices which are calculated in order to determine consumer confidence. These indices are calculated using the average of net responses of parameters such as income, spending, economic situation, employment and price level for the current year and the following year, respectively, as the names suggest. The indices can take a value between 0 and 200. A value above 100 for the indices suggests that people are optimistic. Since the removal of household circumstances parameter since 2015, the parameter has also been removed from the calculation of the indices.
What is the current scenario?
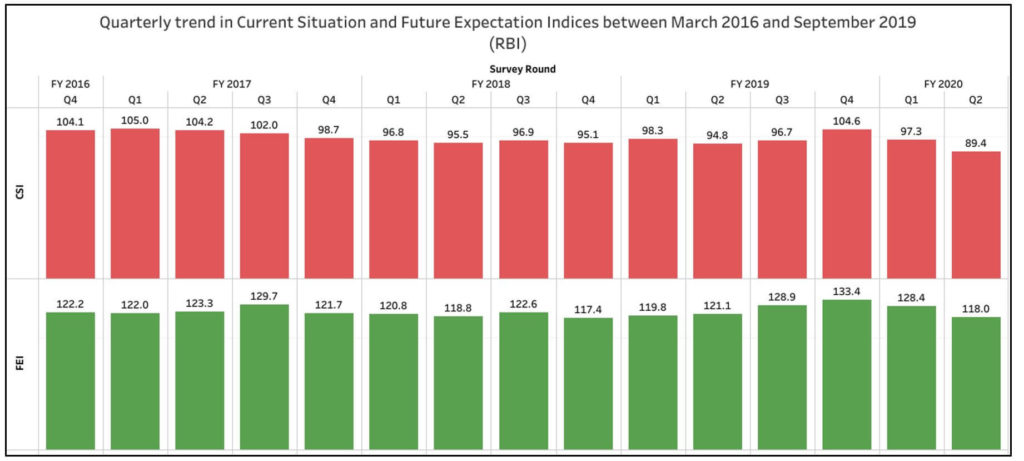
The result of the latest round of survey conducted in September 2019 shows that Consumer Confidence has declined as compared to July 2019. In fact, both the Current Situation Index (CSI) and Future Expectation Index (FEI) have touched a 5-year low.
Respondents feel that price levels have increased in the last one year and are also expecting it to rise in the following year. In the case of overall economic situation and employment as well, confidence of respondents, both in the present case scenario as well for future, have dropped. Same is the case with income. The sentiment on spending on essential items has become stronger in contrast to spending on non-essential items, which has weakened, may be because of increasing price levels. Majority of the respondents (74.1%) were of the opinion that their spending has increased in the last one year and a higher number (77%) felt that their spending would only increase next year owing to increase in prices.
Does GDP growth rate have an impact on confidence of consumers?
Since GDP is influenced by the nation’s demand, there is a tendency to assume that perception of a consumer will also be related to it. There are multiple factors which influence GDP as well as the sentiments of consumers.
The trend in GDP growth rate and Consumer Confidence Indices have been represented in graphs for ease of comparison. Data between March 2016 and June 2019 has been taken.
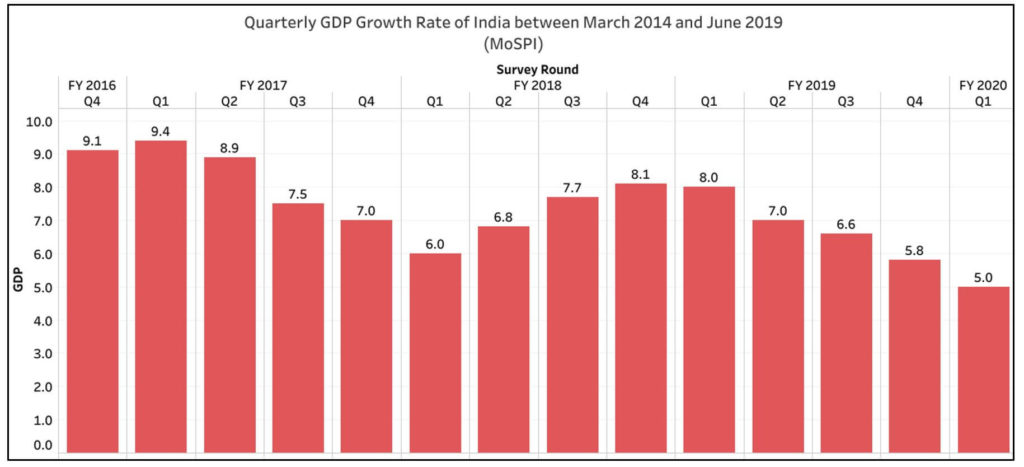
During this period, the GDP growth rate touched the highest in the first quarter of Financial Year (FY) 2017. In the same period, it can be observed that the Current Situation Index (CSI) was also the highest. Future Expectation Index (FEI) was the highest in fourth quarter of FY 2019 when the GDP growth was only 5.8%. The CSI was also substantially higher in the fourth quarter of FY 2019 compared to the same period in FY 2018 despite lower GDP growth rate in FY 2019. Following the 5% GDP growth rate in first quarter of FY 2020, which is a 6-year low, the CSI in the second quarter of the same year dropped down to the least in six years.
Are the findings of the survey used for any policy decisions?
The survey, just like other surveys, has its own methodological shortcomings. For instance, the sample size is small for a highly populous country like India. Further, only urban households are considered in the sample from large cities despite more than 65% of population living in rural areas. However, the Monetary Policy Committee of RBI refers to the survey results to forecast growth and inflation in their half yearly reports.


1 Comment
Pingback: Explainer: What is Consumer Confidence Survey and what does it indicate? - Fact Checking Tools | Factbase.us