The Women and Men in India, 2021 report, released by MoSPI is the collection of a variety of gender-related statistics that are released by different agencies of the government. This serves as a single go-to platform to find information pertaining to gender statistics. Here is a review of some of the important indicators.
One common theme that permeates through every level of Indian society is discrimination on varied grounds. This could be in the form of caste discrimination, gender discrimination, racial discrimination, class discrimination, and so on. This pervasive phenomenon is rampant despite constitutional protection in the form of Article 15 of the Indian Constitution. More than 80% of Indian legal framework has measures that promote and enforce gender equality. However, the goal of gender equality remains distant, with India standing at 140th position out of 156 countries in the Global Gender Gap Index, 2021 published by the World Economic Forum.
Indian projected population for 2021 was 136.3 crore, out of which the female population is around 48.6%. When half of the population is female, one cannot afford to keep them out of the country’s development vision. A World Bank report on the economic costs of gender inequality estimated the loss in human capital wealth to be around USD 160.2 trillion globally. Moreover, gender equality is adopted as Goal 5 under the Sustainable Development Goals.
On that note, we look at some of the crucial indicators of gender equality using the Women and Men in India, 2021 report by the Ministry of Statistics and Programme Implementation (MoSPI) in today’s story. All the data is sourced from this report, without delving into the individual data sources.
About the report
The Women and Men in India, 2021 report, released by MoSPI is the collection of a variety of gender-related statistics that are released by different agencies of the government. This serves as a single go-to platform to find information pertaining to gender statistics. The report is divided into six chapters based on diverse aspects of gender – Health, education, participation in economy and decision making, impediments to empowerment, and population-related metrics. Looking at such diverse aspects is crucial to adopt an interdisciplinary approach to minimize gender inequality. It is important to note that this report is only the aggregation of gender statistics and does not provide the underlying reasons for under-performance or over-performance in any indicator.
Population related metrics
One of the basic metrics that can be used to gauge the extent of parity between individuals of different genders at a given time is the sex ratio. It is defined as the number of females per 1000 males in each population group. This ratio is majorly affected by the birth and death rates, the levels of migration, and so on. It also gives an idea about the relative survival potential of the genders. In India, the sex ratio had gradually fallen from 946 in 1951 to 926 in 1991, except for 934 in 1981. From 1991 onwards, there is a consistent improvement in the sex ratio. It improved from 926 in 1991 to 945 in 2021. The figures for 2021 are projections by the technical group.
If we look at the data about the annual exponential growth rate of population for males and females, the growth rate for males increased from 1.24 in 1951 to 2.27 in 1971, after which the growth rate has fallen to 1.07 in 2021. In the case of females, the growth rate rose from 1.26 in 1951 to 2.23 in 1981, with a subsequent decline to 1.10 in 2021. It is not plausible to deduce whether the latest improvements in sex ratio are due to the initiatives of the government promoting gender equality or due to these unequal growth rates.
Further, the sex ratio is not uniform across different age groups. In 2011, the sex ratio for the old age group (60+) is way higher at 1033, than the sex ratio of 908 for the 0-19 group. The sex ratio for the economically active age group (15-59) is 944, which is approximately the same as the overall sex ratio. Across the states, only Bihar and Gujarat reported negative performance, while the North-Eastern states reported a significant improvement in the 10 years from 2001 to 2011.
Health Statistics:
Infant Mortality Rates (IMR):
IMR is a critical indicator that provides a glimpse of the health and well-being of the population and the community. It is defined as the ratio of the number of deaths of infants below one year of age to 1000 live births during the same period. In India, the overall IMR has been consistently declining from 53 in 2008 to 30 in 2019. This decline is greater in females than in males. Apart from the general causes like the poor health care delivery system, socio-economic causes like malnutrition and hygienic conditions play a crucial role in determining the IMR.
Maternal Mortality Rate (MMR):
The Maternal Mortality rate (MMR), which is defined as the ratio of the number of women who died due to pregnancy complications to one lakh live births in that period, has been declining from 254 in 2004-06 to 103 during 2017-19. Anaemia in pregnant women is one of the important factors that define maternal and foetal complications. The percentage of pregnant women aged 15-49 years who are anaemic increased from 50.4 in NFHS-4 to 52.2 in NFHS-5. Such an increase in anaemic pregnant women could affect the gains achieved in the MMR. Likewise, the percentage of institutional births improved from 38.7% in NFHS-3 to 88.6% in NFHS-5, the home births conducted by skilled health personnel declined from 4.3% in NHFS-4 to 3.2% in NFHS-5.
Obesity:
Obesity, hypertension, and diabetes are the major reasons behind the growing number of non-communicable diseases (NCDs) across the world. Around 55 million people are at risk of death if enough and timely interventions are not taken to control NCDs as per WHO. In fact, India is the first country to adopt a strategy to minimize deaths due to NCDs by 25% by 2025.
Obesity in India has increased in both genders. While the percentage of men who are obese increased from 18.9 to 22.9, female obesity increased from 20.6 to 24.0 from NFHS-4 to NFHS-5.
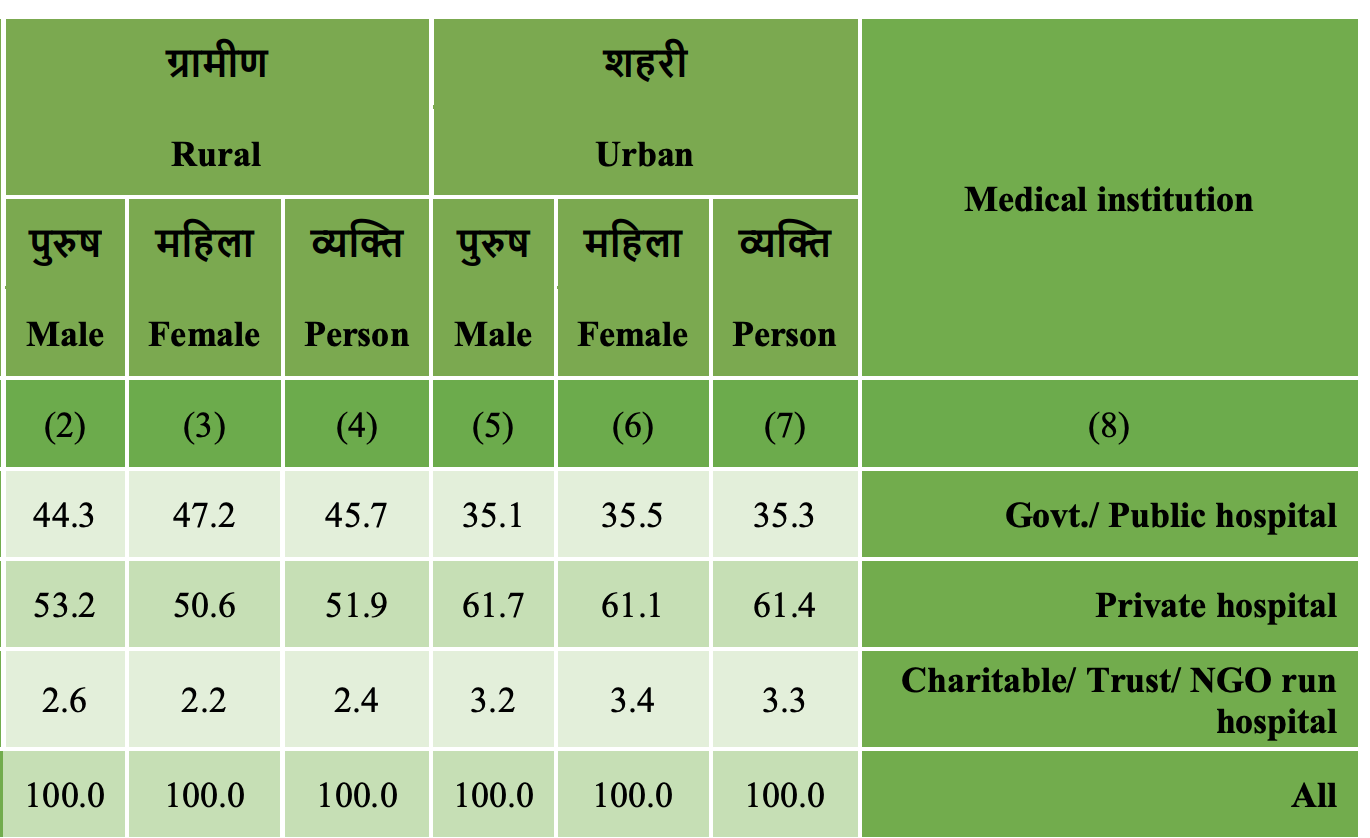
Hospitalization:
Public health infrastructure in India is in a bad shape. The COVID-19 pandemic exposed the vulnerabilities of the Indian health care system, including the lack of adequate public health infrastructure. The public health infrastructure is unable to cater to the needs of the population because of the insufficient expenditure on health infrastructure, and the poor service delivery in public health institutions among other reasons. This difference is quite evident in the proportion of people using different types of health infrastructure in rural and urban areas, as highlighted in the report.
Education:
Education is among the crucial social indicators that have a cross-cutting impact across sectors. For literacy rate, any person of 7 years and above age, who can read as well as write, with an understanding in any language is considered literate. While there has been an improvement in the literacy rates of both men and women, the improvement is not uniform across the genders. While the male literacy rate improved from 27.2% in 1951 to 84.7% in 2017, the female literacy rate grew from 8.9% to 70.3% during the same period. The efforts to educate women have gained traction in the last decade, as is evident in the 8.8% improvement in 2017 over 2011. The top 5 states with the highest gender gap in literacy are Rajasthan (23.3%), Bihar (19.2%), Uttar Pradesh (18.4%), Jharkhand (18.3%), and Jammu and Kashmir (17.7%). Only three states have this gender gap below 10% – Kerala (2.2%), West Bengal (8.7%), and Assam (8.9%).
The Gender Parity Index (GPI) which is defined as the number of female students enrolled at all levels of education to the number of male students enrolled is also rising, indicating the growing realization of the importance of education for women. If GPI is 1.0, then it can be deduced that females and males participate equally in each stage of education. GPI of 1.0 was achieved in 2009-10 for Primary (I-V), in 2012-13 for Upper Primary (VI-VIII), in 2014-15 for Secondary (IX-X), in 2015-16 for Senior Secondary (XI-XII), and in 2018-19 for Higher Education. This shows the delayed but positive steps towards ensuring literacy for all.
Teacher availability:
The availability of female teachers is an important factor for females to continue pursuing education as well as in creating an impact on gender relations in society at large. While the primary level has more female teachers than male teachers, their number declines as we move up the education levels. Higher secondary has the least number of female teachers per 100 male teachers. In 2019-20, the primary level had 125 female teachers per 100 male teachers, compared to 92 in upper primary, 82 in secondary, and 76 in the higher secondary levels. This absence of female teachers at levels of education where the girls reach the age of puberty is one of the reasons behind the higher drop-out of females.
Educational preferences:
In higher education, around 97% prefer general courses (humanities, sciences, and commerce), while the rest prefer technical/professional courses. Among these technical courses, women dominate medicine with 13.8% preference compared to 4.9% for men. Engineering is where men dominate with 41.6% choosing it, while only 28.2% of females prefer engineering. Similarly, education is dominated by women (14.6%) compared to men (5.3%), while ITI is preferred by men (20%) over women (6.4%).
Participation in Economy:
Economic empowerment of women is a key driver to achieving gender equality. It includes the ability of women to participate in existing market conditions, control and access over resources, and increased participation in economic decision making. However, the worker population ratio in India across all the age groups presents a poor picture of women’s participation. It is 53.9% for men as compared to 21.8% for women.
There is also a disparity in the percentage distribution of workers by type of employment. Under self-employed conditions, 35% of females work as a helper in the household enterprise, while only 8.5% males work in similar employment. Around 44% of men work as own-account worker, employer, only 21.3% of women work in the same status.
In terms of financial aspects, women hold up to 33% of the total accounts in the scheduled commercial banks. This translates to 18.61% of the total amount of deposits in the scheduled commercial banks.
Participation in decision making:
Representation of women across the key branches of the government setup is considered vital for progress on gender equality as well as on other issues that could potentially impact women. Ranging from policy prioritization to policy implementation, women at any level of decision-making could have a positive impact.
Legislature:
The representation of women in legislature in India is dismal. The overall percentage of women in legislatures is around 9%. This is well below the aimed representation of 33% as envisioned under the Women’s Reservation Bill- Constitution (One Hundred and Eighth Amendment) Bill, 2008. Only 9 states in India have a percentage of female legislatures above 10% but below 15%, while only Mizoram has 26% female legislatures.
Judiciary:
In Judiciary, the Supreme Court has merely 12% female judges. Indian Judiciary is still considered a ‘Man’s World’. This pattern is also evident across the high courts of different states. Only Telangana and Sikkim high courts have more than 30% female judges, the rest of the High Courts have below 30%. Nine High courts have less than 10% of female judges.
Impediments to women empowerment:
The safety of women is of utmost importance to ensure their participation without any hindrance. The crimes against women as a percentage of total crimes committed at all India level has remained at 7% during 2015-18, which dropped to 6% in 2020. The majority of the share of the crimes against women are reported under Section 498A (Cruelty by Husband and Relatives), Section 354 (Assault on women with intent to outrage her modesty), and Section 363 to 373 (Kidnapping & Abduction) of the Indian Penal Code, 1860.
Nine (9) States account for more than 70% of the crimes committed against women. Uttar Pradesh tops in the crimes against women with 13.3% of the total, while West Bengal, and Rajasthan stand in second and third positions. Among cases of rape, more than 80% of the rape victims belong to 12 states, the majority belonging to Rajasthan with 19%, followed by Uttar Pradesh and Madhya Pradesh with 9.9% and 8.3% respectively.
In crimes against women as a percentage of total crimes committed in the state, Assam stands out with 21.7%, followed by Sikkim (20.7%) and Odisha (18.9%). Ironically, Uttar Pradesh, which has the highest percentage share of crimes against women among the states, has 7.5% of the crimes against women against the total crimes committed in the state. Gujarat (1.1%) and Kerala (1.8%) are the only two states with less than 2% of their total crimes committed against women.
Featured Image: Men & Women in India

