NITI Aayog recently released the Multidimensional Poverty Index (MPI): A Progress Review 2023. This report looks at India’s progress in reducing multidimensional poverty between NFHS-4 (2015-16) and NFHS-5 (2019-21). Data indicates that 14 States had less than 10% of its population living in multidimensional poverty compared to 7 states give years ago.
Income, per capita expenditure, and consumption were the factors that were generally considered to estimate poverty in the country. However, since NITI Aayog was constituted, the multi-dimensional character of poverty was considered after acknowledging the Global Multidimensional Poverty Index that captures overlapping deprivations in health, education, and living standards. In 2021, NITI Aayog released the National Multidimensional Poverty Index: Baseline Report 2021. The baseline report of India’s first-ever national MPI measure is based on the reference period of 2015-16 of the National Family Health Survey (NFHS) (NFHS 4th round). Recently, the Multidimensional Poverty Index (MPI): A Progress Review 2023 based on NFHS 5th round (2019-21), was released which looks at India’s progress in reducing multidimensional poverty between NFHS-4 (2015-16) and NFHS-5 (2019-21).
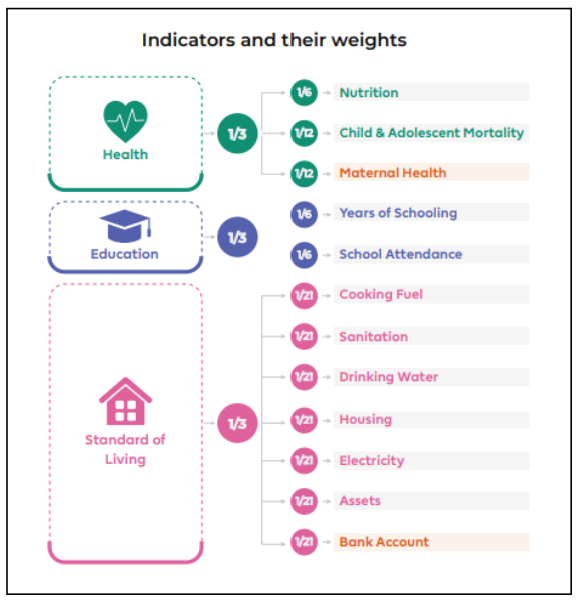
12 indicators across health, education & standard of living dimensions are considered
NITI Aayog’s Multidimensional Poverty Index (MPI) is based on three dimensions — health, education, and standard of living — with each having a weightage of one-third in the index. These dimensions are further based on 12 segments — nutrition, child and adolescent mortality, maternal health, years of schooling, school attendance, cooking fuel, sanitation, drinking water, electricity, housing, assets, and bank accounts.
There are two indices used for arriving at the MPI Value. MPI is the product of the following two indices.
- Headcount ratio which indicates how many are poor.
- The intensity of poverty which indicates how poor are the poor.
The National Multidimensional Poverty Index is key in assessing advancements towards target 1.2 of the Sustainable Development Goals (SDGs) which aims at reducing “at least by half the proportion of men, women and children of all ages living in poverty in all its dimensions” by 2030.
Over 135 million people exited multidimensional poverty in the between 2015-16 & 2019-21
According to the latest report, India is on track to achieve this target. The number of “multidimensionally poor” individuals in India has reduced by 9.89% from 24.85% in 2015-16 to 14.96% in 2019-21. That is, the number of multidimensional poor individuals has come down from 1 in 4 individuals to nearly 1 in 7 individuals. In absolute figures, over 135 million people, or 13.5 crore individuals exited multidimensional poverty between 2015-16 and 2019-21.
The report also reveals that there is a huge disparity in the number of people in poverty in rural and urban areas. In rural areas, the share of individuals in multidimensional poverty dropped significantly from 32.59% in 2015-16 to 19.28% in 2019-21. The same declined in urban areas from 8.65% to 5.27%.
Among states, in these five years between the NFHS surveys, Bihar witnessed the fastest decline in the percentage of multidimensional poor from more than 51% to below 34%. Despite the steep decline, Bihar continues to have the highest share of a multidimensionally poor population for a state with every 1 in 3 persons in the said category. In fact, except for Bihar, no other state in India has more than one-third of its population living in multidimensional poverty.
Madhya Pradesh and Uttar Pradesh are the other two states with a fast reduction in MPI value. The proportion of multidimensional poor in Madhya Pradesh and Uttar Pradesh in NFHS-5 (2019-21) is 20.63% and 22.93% down from 36.57% and 37.68%, respectively during 2015-16.
In terms of number of MPI poor, Uttar Pradesh recorded the highest number of persons exiting multidimensional poverty in the last five years with 3.43 crore persons, followed by Bihar with 2.25 crore and Madhya Pradesh with 1.36 crore persons exiting multidimensional poverty. These 3 states account for more than 50% of those who exited multidimensional poverty during this period.
All South Indian states have less than 10% population in poverty
As far as other states are concerned, Goa & Kerala had only less than 1% of the population in multidimensional poverty. The number of states with less than 10% of people living in multidimensional poverty has doubled in the five-year period considered. According to the report, in 2015-16, only seven states had less than 10% of their population living in multidimensional poverty — Mizoram, Himachal Pradesh, Punjab, Sikkim, Tamil Nadu, Goa, and Kerala. However, in 2019-21, a total of 14 states including Telangana, Andhra Pradesh, Haryana, Karnataka, Maharashtra, Manipur, and Uttarakhand had less than 10% living in multidimensional poverty. All five South Indian states fall into this category.
All the 12 indicators have recorded an improvement
All 12 indicators across the three dimensions – Health, Education, and Standard of Living– saw improvement in the five years. A significant reduction in deprivations in sanitation (by 21.8 % points) and cooking fuel (by 14.6 % points) was observed during the period from 2015-16 to 2019-21. There has been considerable progress in nutrition, years of schooling, sanitation, and cooking fuel as evident in the graph below. Most of the indicators under Standard of Living are the ones that have significantly contributed to the decline in MPI despite further scope for improvement. That is, more than 40% are still deprived of cooking fuel and housing. Likewise, more than 30% are deprived of sanitation and nutrition. It should be noted that the indicators across health and education (child and adolescent mortality, maternal health, years of schooling, etc.) have not witnessed a notable improvement.
Targeted interventions and policies have been lauded for this progress
The report has attributed the improvement in MPI to the targeted policies, schemes, and developmental programmes of the governments at national and sub-national levels. The Government of India schemes such as Swachh Bharat Mission (SBM), Jal Jeevan Mission (JJM), Poshan Abhiyan, Samagra Shiksha, Pradhan Mantri Sahaj Bijli Har Ghar Yojana (Saubhagya), Pradhan Mantri Ujjwala Yojana (PMUY), Pradhan Mantri Jan Dhan Yojana (PMJDY), Pradhan Mantri Awas Yojana (PMAY) have contributed significantly to driving the progress, according to the report.
While the schemes for a better standard of living may have a wide reach in a numeric sense, it is to be seen if these are equally effective qualitatively. For instance, Factly’s story revealed that the average number of refills of cylinders under the PM Ujjwala Yojana is low. Further, focused interventions and increased budgets for improving the health and education of people are necessary as the improvement under these indicators was slow.
Global MPI report also corroborates the findings of the NITI Aayog report
The global Multidimensional Poverty Index (MPI) with estimates for 110 countries was also released by the United Nations Development Programme (UNDP) and the Oxford Poverty and Human Development Initiative (OPHI) at the University of Oxford a few weeks before NITI Aayog released India’s report. As per UNDP’s publication, India saw a remarkable reduction in poverty, with 415 million people exiting poverty within a span of 15 years from 2005-06 to 2019-21. As pointed out by NITI Aayog’s report, the Global Multidimensional Poverty Index report also reported that India’s progress towards SDG Target 1.2 is attainable since India halved its Global MPI well within 15 years. It also added that deprivation declined across all indicators in the country with the poorest states and groups, including children and people in disadvantaged caste groups, having the fastest absolute progress.
Nonetheless, nearly all the data considered in the UNDP report are from before the COVID-19 pandemic. The report calls for fully updated data from after the COVID-19 pandemic to understand if the trends in poverty reduction continue after the pandemic. Many studies flagged the reversing of decades of progress on poverty, healthcare, and education due to the pandemic. The UNDP report also emphasized how data on multidimensional poverty is left behind during this era of the “Data Revolution”.

