Between 2016-17 and 2020-21, an average of 19% of the states did not report data on the generation of one or more types of solid waste. While the reporting has greatly improved in 2020-21, it remains incomplete and inadequate. Even this limited data shows consistent increase in the generation of different types of solid waste with low recycling rates.
In the contemporary world of increasing population, urbanization, lifestyle changes, and other anthropogenic activities, the management of generation and disposal of Solid Waste (SW) has become one of the major global challenges and pressing issues with multiple negative impacts on the environment and people. As per the recent estimates of World Bank (WB), about 2.24 billion tonnes of SW was generated in the year 2020 alone with a per capita footprint of 0.79 kilograms per day. The same is projected to increase by 73% to 3.88 billion tonnes by 2050. Further, as of 2022, less than 20% of globally generated solid waste is recycled, leaving the rest of the waste either as open dumps or in landfills.
As per another 2016 report of WB, about 1.6 billion tonnes (about 5% of total emissions) of the global Green House Gases (GHG) emissions were caused primarily by open dumping and landfilling solid waste without capturing landfill gaseous emissions. The same report also estimates that by 2050, the GHG emissions of SW will increase to 2.4 billion tonnes if no improvements are made in the management of SW.
In this story, we look at the SW generation, recycling, and disposal in India
Methodology
The Data has been sourced from the Solid Waste Datasets collection by Dataful, which has compiled different types of SW data from the Central Pollution Control Board (CPCB) Annual Reports and data provided in the responses given by the government in Parliament. The analysis presented in the story is limited to data given in both these sources.
Limitations in Data recorded by the CPCB
- The CPCB only compiles different types of SW data submitted by States of India. The CPCB also records in their annual reports that some of the states have not submitted different types of SW data during different years.
- The SW data presented in CPCB reports is only based on the SW data recorded by States, but not the complete data of actual SW generation, collection, treatment, and disposal.
For both the above reasons, the different types of SW data may not be complete and are expected to be significantly more than the data presented in CPCB reports.
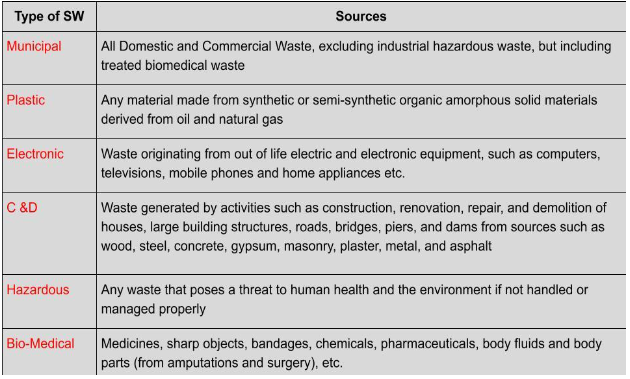
CPCB Records 6 types of Solid Waste Data
The ‘Solid Waste’ as per Solid Waste Management Rules (SWMR) in India is defined as Solid or Semi-Solid Waste generated from domestic, commercial, sanitary, agricultural, dairy, horticulture, bio-medical (including treated bio-medical), electronic, radioactive, battery and other sources. In other words, multiple types of sources generate Solid Waste in India every day.
The CPCB maintains data about the following 6 types of SW in India, details of which along with the sources from which each of SW is generated are provided below.
Complete Data of SW Generation is not recorded in India
In the previous story on Plastic Waste, it was highlighted that Plastic Waste generation data is not being completely recorded and is not being provided by some of the states and local bodies. The analysis of other types of SW generation data also reveals that the same issue prevails for other types of SW as well.
For example, the analysis of Construction and Demolition (C&D) waste data furnished by CPCB in the parliament shows that 28 out of the 36 States and Union Territories (UTs) have not submitted data about C&D waste in the year 2021-22. Apart from 2021-22, there is no information in the public domain about C&D waste for the previous years. Therefore, it shows that C&D waste generated over the years in India has not been indented and recorded. The partial data submitted by 8 States and UTs shows that about 7,505 tonnes of C&D waste is generated per day in the year 2021-22.
Similarly, the analysis of other types of SW data also shows that several states have not submitted the data of different types of SW generated over the years.
Data shows that from the year 2016-17 to 2021-22, an average of 19% of states have not provided information about one or more types of solid waste. Only Bio-medical waste has been consistently recorded and submitted by most of the states over the years. The other types of SW such as Hazardous, Electronic and Plastic Waste have not been consistently reported across the years by the states. It is only from the year 2018-19 onwards that most of the states have begun to consistently report about different types of SW. Progressively, the situation has improved and as of 2020-21, most of the states have reported about different kinds of waste.
However, as reported earlier, the data that is recorded and submitted by states even from the year 2020-21 do not reflect the actual volumes of different types of SW generated in India. For example, the 2020-21 CPCB annual report on Hazardous Report notes that “Out of 76,235 units (Hazardous Waste units), only 48,764 units (i.e. 64%) have submitted annual returns to concerned SPCB/PCCs” Thus, the data recorded on Hazardous Waste is limited. Similarly, Plastic, Electronic, and other types of SW recorded by State Pollution Control Boards (SPCBs) are based on the firms, institutions, local bodies, and other such agencies that from time to time provide these details. The SW data which is not recorded by these bodies does not get indented by SPCBs and hence does not become part of the information submitted by SPCBs to the CPCB. In essence, the yearly figures for different types of Solid Waste provided by the CPCB do not reflect the actual SW generated in India.
Recorded Data shows steep increase in the SW waste generated with Lower Rates of Recycling
The analysis of data recorded from 2018-19 to 2020-21(except electronic waste for which data is recorded from 2017-18 to 2019-20) shows that 5 types of SW generated in India have shown an increase, except C&D waste data where only 2021-22 data of few states has been provided.
The data shows that within three years, the generation of Municipal, Electronic, Hazardous, Bio-Medical, and Plastic Waste generation has increased by 2,94,900 (5%), 3,06,516 (30%), 5,98,876 (6%), 15,289 (6%) and 7,66,765 (18%) tonnes, respectively.
However, the rates of recycling of SW in India are very low. As mentioned above, the C&D waste generated is not indented so far in India, except for 2021-22. According to a study conducted by the Center for Science and Environment (CSE), India recovers and recycles only 1% of this C&D waste. Further, as per the 2019-20 data, the total Electronic SW that is sent to dismantlers and for recycling is only 22% of the total e-waste generated. Similarly, the 2018 TERI report notes that only about 28.4% of plastic waste generated in India is recycled. Furthermore, the CPCB’s annual report notes that only about 27.4% (25,34,726 tonnes) of total 92,38,103 tonnes of Hazardous SW generated in 2020-21 is recyclable. Even the total Municipal SW which is recycled is only about 50% of the total generated in 2020-21. Overall, the data shows that the rate of recycling of different types of SW generated in India is very low as of date.
When each of these 6 types of SW remains unutilized in open dumps or landfills, they are well known to have consequential negative impacts on the environment, people, and also on flora and fauna. These negative impacts include pollution of air, water, and soil, GHG emissions, climate change, health problems such as respiratory, cancer, neurological, and brain disorders, and shortage of life expectancy, among many others.
SW Carrying Capacity of India is a serious issue which needs to be addressed
Factly’s previous story on Plastic Waste highlighted the fact that the global Plastic Waste generation alone has overshot the carrying capacity of the Earth by 157 days in the year 2023. In India, the limited data compiled by CPCB shows a total of 21,24,85,564 tonnes of SW is generated within a span of 6 years from the year 2017-18 to 2021-22. Of this, the recycling of different types of SW suggests that an average of only 30% of total SW is recycled. The rest of the unutilized SW of about 14,87,39,894.8 tonnes at 70% remains either in landfills or in the open dumps.
The Supreme Court of India decades ago held in C. Kenchappa case that “The pollution created as a consequence of development must not exceed the carrying capacity of ecosystem” In the present scenario, the SW data certainly suggests rising levels of waste generation. This poses serious questions on the carrying capacity of India and calls for robust measures.

