The much awaited Railway Budget-2015 was presented by the Railway Minister Mr. Suresh Prabhu in the Lok Sabha yesterday. While you will find information on the allocations almost everywhere, we decided to do the number crunching on the passenger earnings of the Indian Railways. So which class of Passengers earn the most revenue for Railways? Let’s look at the numbers first.
[orc]Financial Year 2013-14 (Actual)
| Class/Type | No of Passengers in Millions | Earnings (in Rs Crores) | Contribution to Total Earnings | Average Revenue per Passenger | Proportion of Total Passengers |
|---|---|---|---|---|---|
| AC Class | 119.57 | 10475.23 | 28.67% | 876.08 | 1.42% |
| First Class | 271.48 | 345.14 | 0.94% | 12.71 | 3.23% |
| Sleeper Class | 309.01 | 9670.39 | 26.47% | 312.95 | 3.68% |
| Second Class | 7696.98 | 16041.48 | 43.91% | 20.84 | 91.66% |
| Total | 8397.04 | 36532 | 100% | 43.51 | 100.00% |
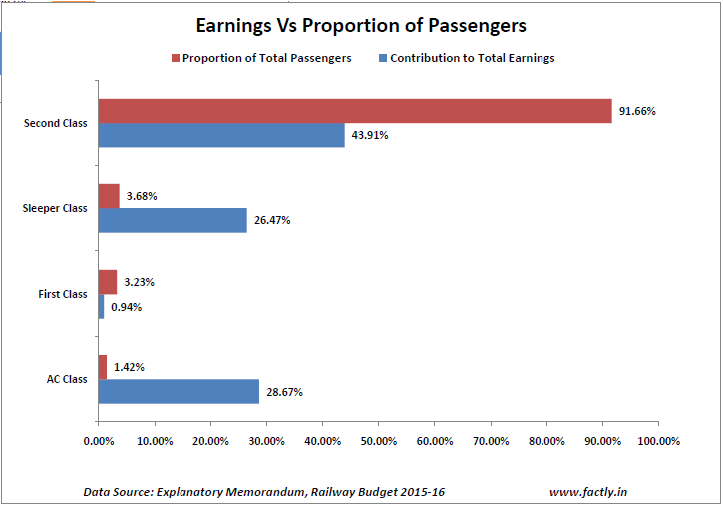
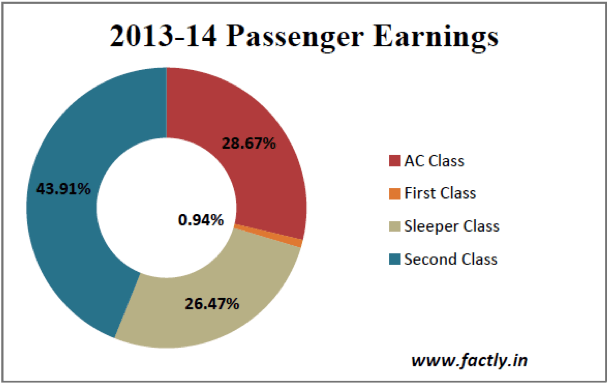
- In the financial year 2013-14, the total passenger earnings for Railways stood at Rs 36,532 crore rupees. 43.91% of these earnings (Rs 16,041 crores) came from Second Class, 26.47% from Sleeper Class & 28.67% from AC Class.
- Average revenue per passenger in AC Class was Rs 876, for Sleeper Class, it is Rs 313 & for Second Class, it is Rs 21. Average revenue per passenger in AC Class is almost 40 times more than the average revenue per passenger in Second Class.
- The total number of passengers who travelled AC Class stood at 120 million while for Sleeper Class, it was 309 million. Bulk of the passengers travelled Second Class and this Class accounted for 7697 million passengers which is 64 times more than the number of travelers in AC Class.
- It is interesting to note that close to 92% of the total passenger traffic come from the Second Class while only 1.42% of the passenger traffic comes from the AC class. This 1.42% accounts for 28.67% of the total revenue.
Similar numbers for the revised estimates for the financial year 2014-15 and the estimates for the year 2015-16 are below.
Revised Estimates for 2014-15
| Class/Type | No of Passengers in Millions | Earnings (in Rs Crores) | Contribution to Total Earnings | Average Revenue per Passenger in Rs | Proportion of Total Passengers |
|---|---|---|---|---|---|
| AC Class | 118.75 | 12330.38 | 28.67% | 1038.35 | 1.42% |
| First Class | 270.27 | 406.26 | 0.94% | 15.03 | 3.24% |
| Sleeper Class | 306.88 | 11382.98 | 26.47% | 370.93 | 3.68% |
| Second Class | 7654.1 | 18882.39 | 43.91% | 24.67 | 91.67% |
| Total | 8350 | 43002 | 100% | 51.50 | 100.00% |
Budget Estimates for 2015-16
| Class/Type | No of Passengers in Millions | Earnings (in Rs Crores) | Contribution to Total Earnings | Average Revenue per Passenger in Rs | Proportion of Total Passengers |
|---|---|---|---|---|---|
| AC Class | 122.32 | 14624.82 | 29.15% | 1195.62 | 1.42% |
| First Class | 277.98 | 449.01 | 0.89% | 16.15 | 3.23% |
| Sleeper Class | 316.13 | 13486.22 | 26.88% | 426.60 | 3.68% |
| Second Class | 7884.57 | 21614.94 | 43.08% | 27.41 | 91.67% |
| Total | 8601 | 50175 | 100% | 58.34 | 100.00% |
Data Source: Explanatory Memorandum, Railway Budget 2015-16


