[orc]The number of Indian students in the US touched an all-time high of 186,267 in 2016-17. But the growth of Indian students in the US hit a 3-year low in 2016-17. Indian Students contributed $6.54 billion to the U.S. economy in 2016-17, more than the total higher education budget of the Indian Government.
The 2017 Open Doors Report on International Educational Exchange revealed that the number of international students at U.S. Colleges and Universities remained at more than a million even in 2016-17. But the annual growth rate of international students in 2016-17 was the lowest in seven years. The number of international students was at 1,078,822 in 2016-17 as opposed to 1,043,839 in 2015-16. The number of Indian Students in the US grew by about 12% in 2016-17, the lowest growth rate in 3 years. This slowdown was expected following the uncertainty in VISA regime and Donald Trump becoming the President.
Asian students in the US now at 68%
As per the Open Doors report, out of the million plus international students in 2016-17, 68% are from Asia (50% from China & India alone), 8.6% are from Europe, 7.4% are from the Latin America, 9.3% are from Middle East & North Africa. A mere 3.5% are from the Sub-Saharan Africa. The percentage of Asians has increased in 2016-17 compared to 2015-16. The percentage of students from Muslim majority Middle-Eastern & North African countries has decreased in 2016-17, clearly indicating the impact of the policies of Donald Trump.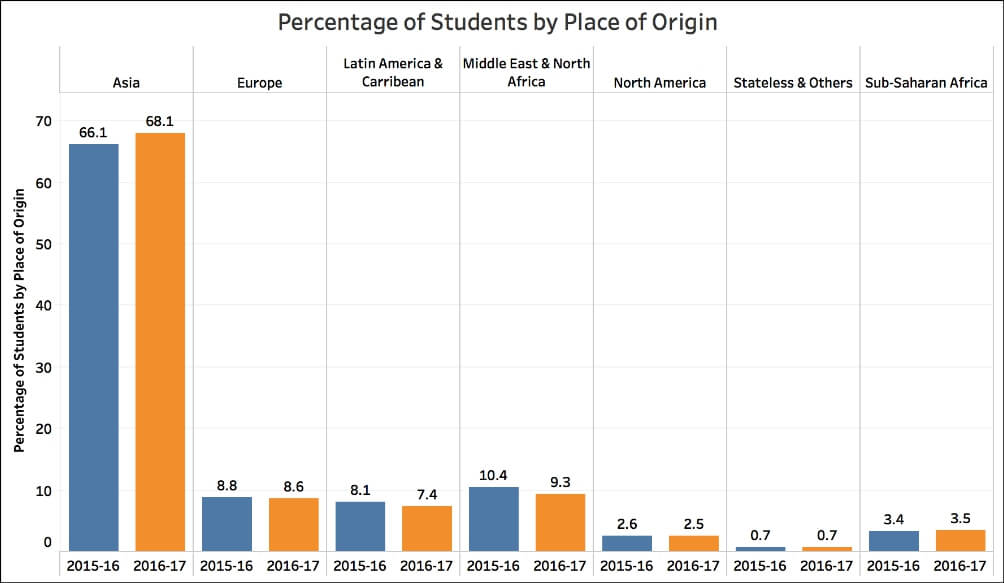
China & India account for half the International students in the US
As expected, the two most populous countries of the world account for close to half of the international students in the US in 2016-17. China leads the pack with 350,755 students followed by India with 186,267 students. South Korea is third in the list followed by Saudi Arabia and Canada. Seven of the top ten countries are Asian. There are more than 10000 international students each from sixteen (16) different countries in 2016-17.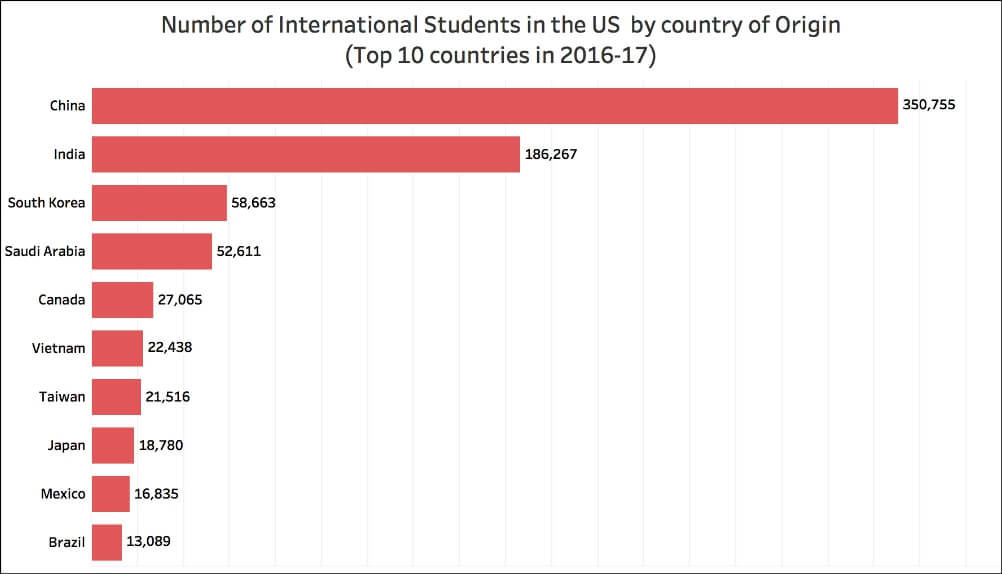
Number of Indian Students in the US increases, but growth falls
The number of Indian students in the US has increased by more five times, from 33,818 in 1997-98 to 186,267 in 2016-17, in a period of 20 years. They currently make up 17.2% of all international students in the USA, up from 15.8% in 2015-16. The number of Indian students has increased in every year except for 2005-06 and the period between 2010-11 and 2012-13 when there was a negative growth. The highest growth rate of 29.4% was observed in 2014-15. The growth in the number of Indian students in 2016-17 was 12.3%, the lowest in 3 years.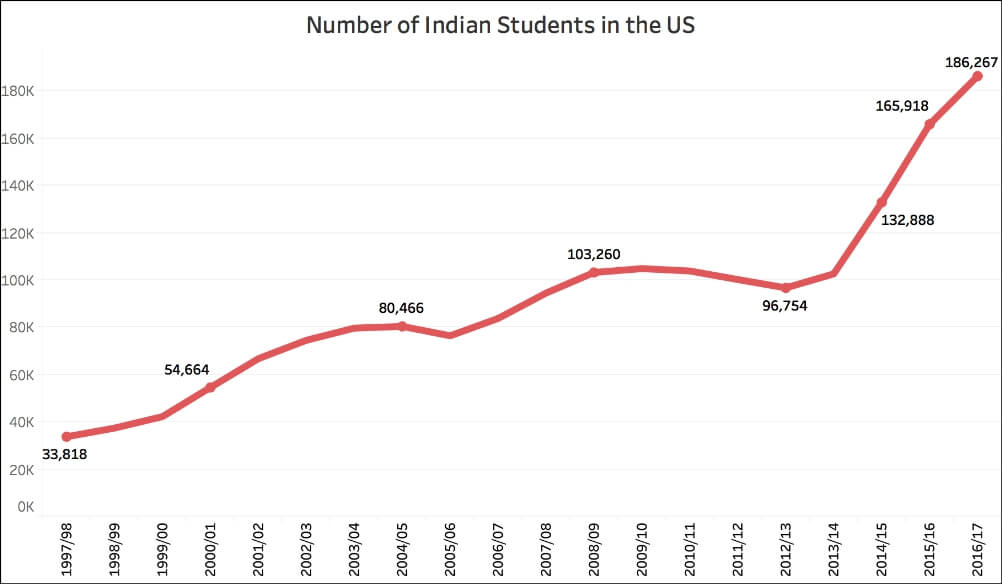
Field of Study – Engineering is still the favourite for Indian Students
True to its name as a land of engineering graduates, more than 70% of the Indian students in the US chose Engineering/Computer Science/Math (STEM) as their field of study as against a global average of 36%. Only about 10% chose Business & Management as their field of study compared to a global average of 18.6%. Except for engineering & computer science, the percentage of Indian students who chose a specific field of study is less than the global average in all other fields. For instance, while 7.7% of the international students chose Social Sciences, only 2.3% of the Indian students chose Social Sciences as their field of study.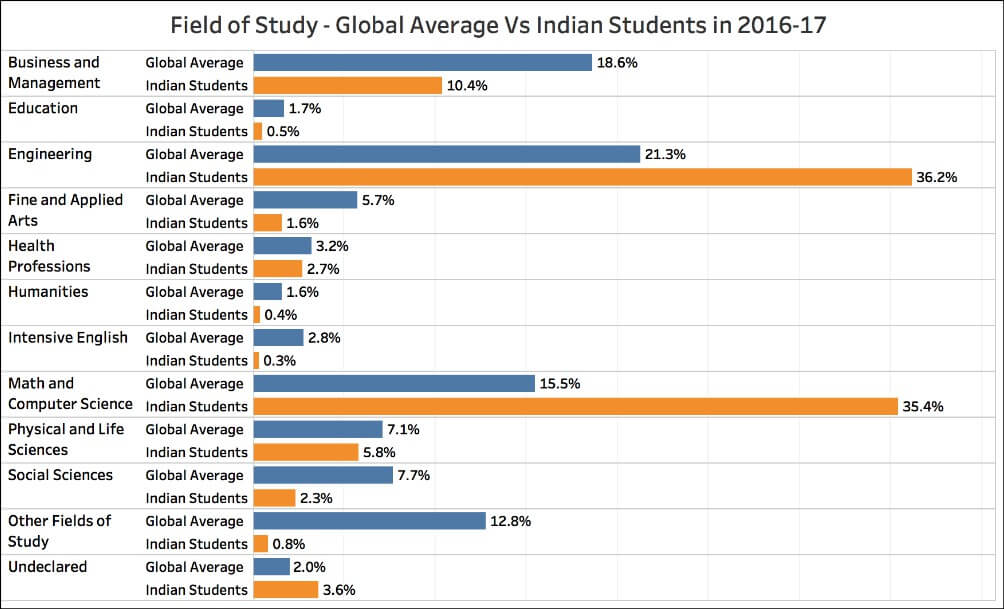
Indian Students contributed USD 6.54 billion to the US Economy in 2016-17
According to the Open Doors report, Indian students in US contributed $6.54 billion to the U.S. economy in 2016-17. This is more than the total higher education budget of Government of India for 2017-18. The international student community on the other hand contributed $39.4 billion to the U.S. economy in 2016.
Most Indian Students go to the US for Masters
56.3% of the Indian students in the USA are at the Graduate (Masters) level in 2016-17, which is less than 61.4% in 2015-16, clearly indicating the impact by the decrease in F-1 visas in 2016. 11.8% of the Indian students are at the Under-Graduate level. More than 30% of them are in OPT (Optional Practical Training) compared to just 22.1% in 2014-15, indicating a slump in the job market & approval of H1-B visas. 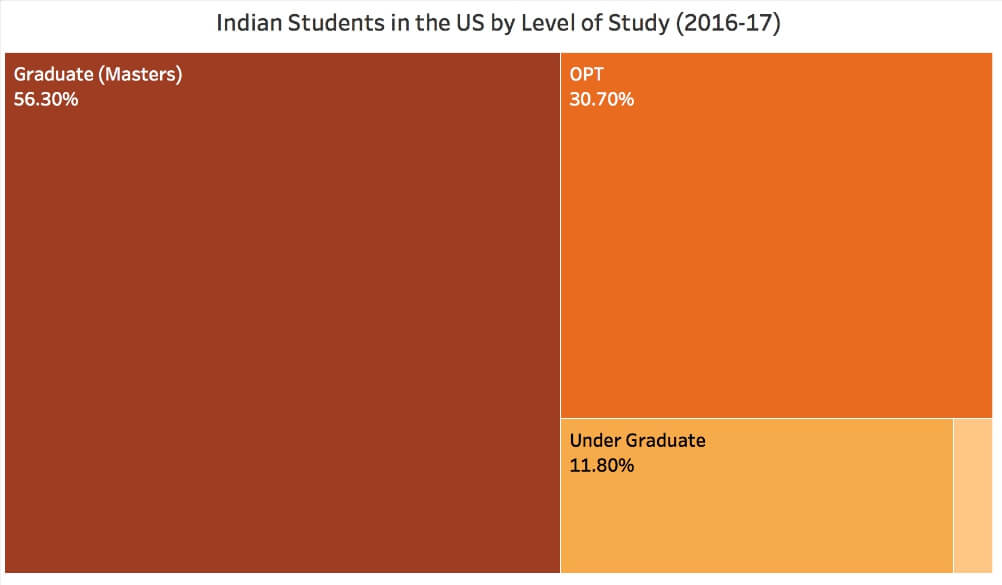 Texas, California & New York still the Favourites
Texas, California & New York in that order were the top three destinations for Indian students in the US in 2016-17. Texas had 21960 Indian students while California & New York both had more than 19000 Indian students each. Illinois was the only other state with more than 10000 students. The top 10 states with Indian students accounted for 65% of all Indian students in the US. It must be noted that Texas was the not the top destination for all international students. It was the 3rd most preferred destination for international students and 1st for Indian Students. The most preferred destination for International students was California followed by New York.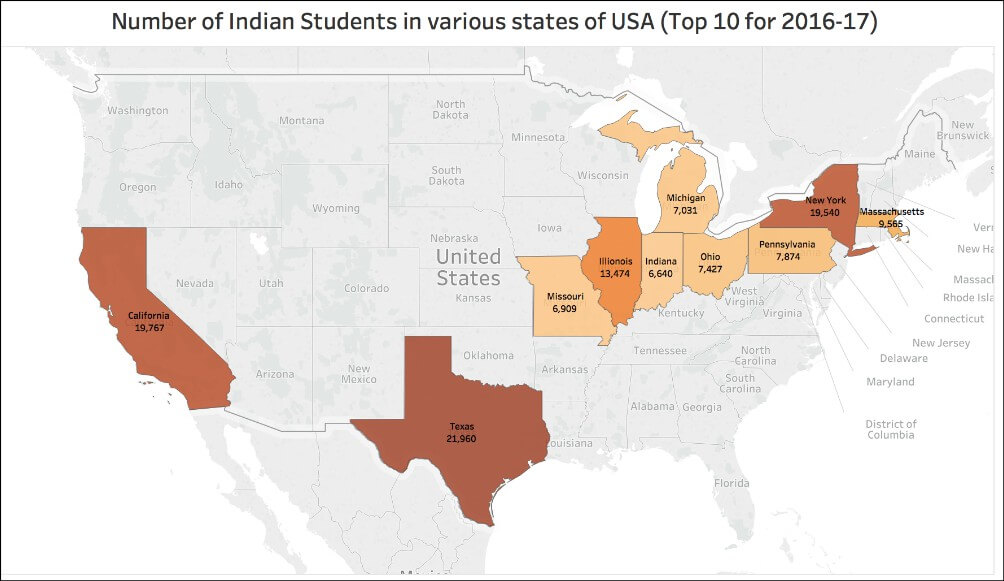
Primary Source of Funding for International Students
For more than 60% of the international students in the US in 2016-17, the primary source of funding was their family. The current employment funded the studies of more than 16% students, up from 6.6% in 2015-16. This indicates that the proportion of people with work experience going to the US for higher studies has gone up. About 15% were funded by a US College or University while 5.73% were funded by a Foreign Government or University.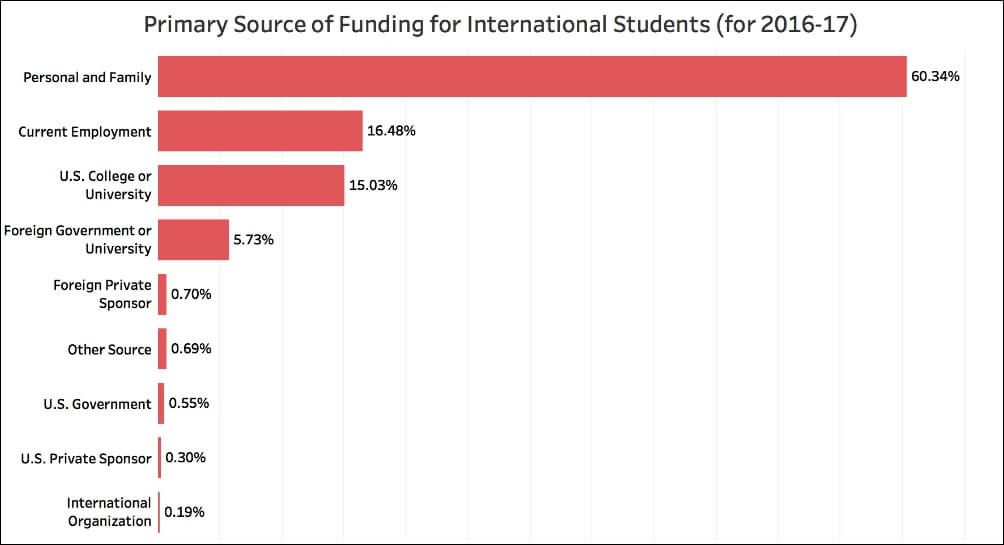


1 Comment
Pingback: India’s Institutional Educational Problem | US India Relationship Blog