The recently released ‘The State of Inequality in India’ report highlights that while India has made remarkable strides in improving the overall conditions of households ensuring proper access to necessities, there are gaps that need to be addressed so that the goals of social progress and shared prosperity are realised. It also notes that the share held by the Top 1% is only increasing, thereby further marginalising the poor.
“The test of our progress is not whether we add more to the abundance of those who have much; it is whether we provide enough for those who have too little.” – Franklin Roosevelt
This quote by Roosevelt sums up the importance of our fight against inequality. Inequality is a malaise that permeates through every level of the society. Inequality is relative. Anyone can feel unequal in any circumstances. Therefore, it is important to understand the dynamics behind defining inequality and the associated benchmarks.
Inequality exists in many forms. While the primary driver for inequality is income levels, factors like gender, race, caste, sexual orientation, and religion also play a significant role in deepening inequality. Sometimes, this inequality stems from a larger power structure with a defined hierarchy, that resists any kind of mobility and transformations. This power structure has variables operating at all levels that intensify the vulnerability of the existing inequalities. Despite all these, there is a global consensus on fighting inequality and striving for a more equal and just society.
The recent COVID-19 pandemic exacerbated the existing inequalities. A report by Oxfam International, ‘Profiting from Pain’, mentions that a new billionaire is created every 30 hours, while there are million people falling into extreme poverty during the same period. This signals the increasing divide between the haves and have-nots. For a country with existing deepened inequalities like India, this increasing gap of inequality is not good.
Against this backdrop, the Economic Advisory Council (EAC) of the Prime Minister of India, asked the Institute for Competitiveness to study and prepare a comprehensive of the state of Inequality in India. Today’s story looks at the report published by them, ‘The state of Inequality in India’. The report looks at four key aspects that influence inequality – Income levels and labour profile, health, education and the household characteristics like sanitation, access to electricity and so on.
India’s income levels and labour profile
Extreme differential income levels are a clear sign of inequality. These differential income levels are often due to mismatches in the supply and demand of the labour, the skills and knowledge capabilities, and the access to the formal labour market. The report looks at the previous Periodic Labour Force Survey’s (PLFS) to gain insight into the Indian income profile and labour market characteristics. The report highlights that a monthly salary of Rs. 25,000 is among the top 10% of the total wages earned as per PLFS 2019-20. It also mentions that the top 1% earns more than thrice the bottom 10%. The report compares the PLFS survey reports from 2017-18, 2018-19 and 2019-20 to analyse the income level differential in Indian society.
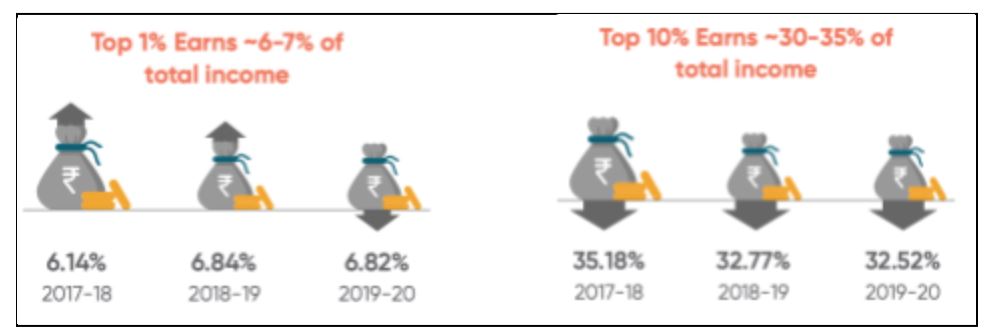
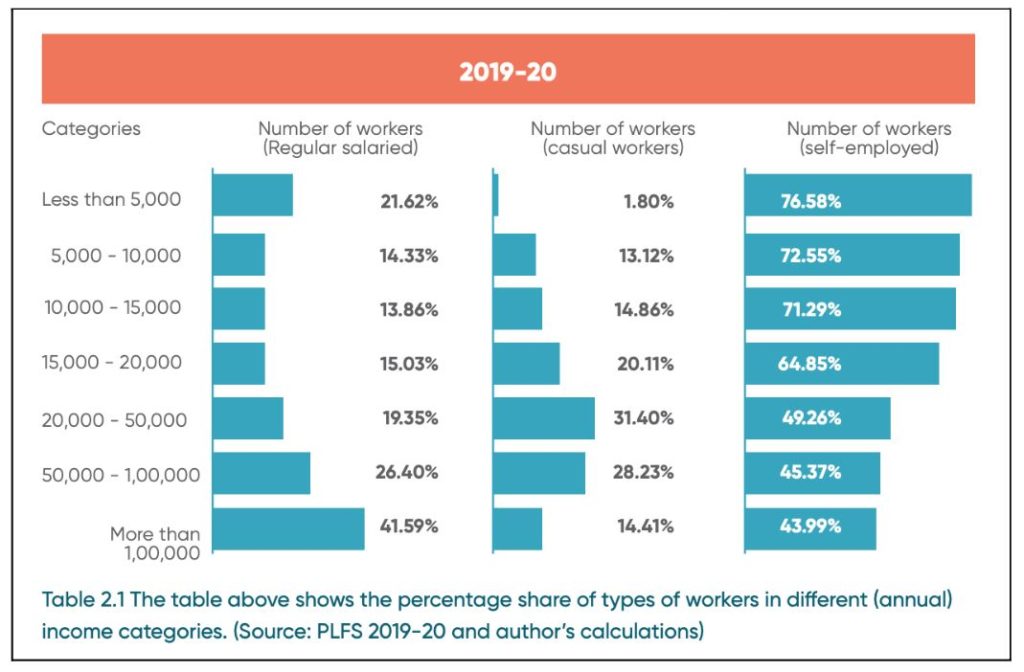
The above images from the report provide the level of inequality between the top 10% and the rest. Even among the top 10%, there is a variation between different levels indicating the pervasiveness of the inequality. It is observed that nearly 15% of the total workforce earns less than Rs. 50,000 per annum. To understand the income profiles, wage earners are categorized into three groups – regular salaried, self-employed, and casual workers. It is observed that around 45% of total employment is self-employed, followed by regular salaried, accounting for around 34%, and the rest as casual workers. Even among these categories, there is a huge variation in their annual income levels. An overwhelming majority of self-employed earn less than Rs. 20,000, while most casual workers earn from Rs. 20,000 to Rs.1,00,000. For regular salaried, the majority earn above 1 lakh per annum.
The report also highlights that there is a marginal improvement in the labour force participation rate for the past three years, with the female labour force participation rate increasing by nearly 7% from 2017-18 to 2019-20. Despite this increase, female participation is still minimal compared to males.
These statistics indicate a positive trend in earning wages, but this increase is concentrated only in a few segments. The report points out the difficulty in tracing mobility in the absence of income and class-based economic ceilings.
Health
The COVID-19 pandemic showcased the significance of a robust and quality health infrastructure. Any approach towards enhancing health care should focus on availability, accessibility, acceptability, and quality. Access to quality healthcare is a key metric that influences inequality. In the absence of adequate and quality health infrastructure, expenditure incurred on health could be a vital determining factor that drives poverty and inequality. It is often said that ‘our middle class is just one hospital bill away from poverty’.
India recorded an improvement in the health infrastructure in 2019-20 compared to 2005.
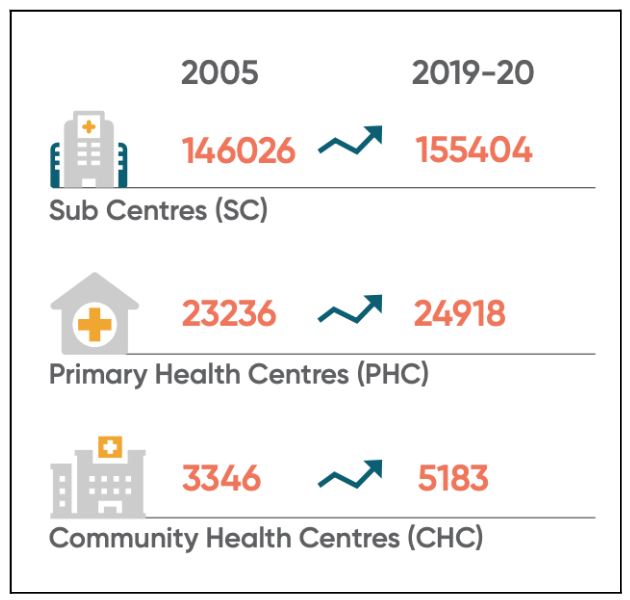
This improvement is despite some states like Uttar Pradesh, West Bengal, Andhra Pradesh, and Jharkhand showing a decline in the number of PHCs. A shortfall in the health infrastructure could lead to an overburdened health care system, which could result in inadequate community interaction and medical attention. In addition to the infrastructure, expenditure determines the affordability of the health care provisioning. The average expenditure in the rural region for government hospitals is Rs. 4,290, while it is Rs. 27,000 for private hospitals excluding childbirth. Similarly, the average expenditure in the urban regions for government hospitals is Rs. 4,400 while it is Rs. 38,000 for a private hospital. This expenditure is more than what the majority of the population earns annually. The vast difference between the private and government facility expenditure is a cause of concern since the government facilities are more focussed on general ailments for primary and secondary care, while the private focus is on specialized and tertiary care.
In terms of malnutrition and child-birth indicators, there is an improvement across the country. The Stunting under five reduced from 38.4% to 35.5% from NFHS-4 to NFHS-5, while wasting reduced from 21% to 19.3%. Despite this improvement, India still accounts for the largest number of malnutrition affected children. It is vital to prioritize health and well-being and make sure that the existing socio-economic conditions do not translate into deepening this existing inequality.
The Education gap
Education is a vital component of building human capital and the overall development of the country. It provides an easy path for socio-economic mobility, thereby minimizing inequality. Unfortunately, India had not invested enough in education over the years. The literacy rate still hovers around 80%, but there is a considerable improvement in the physical infrastructure. More than 97% of the schools in India have access to safe drinking water on the premises, and around 95% of the schools have functional toilets, as per the latest government surveys. The share of schools with electricity facilities increased to 83.4% in 2019-20 from 54.6% in 2012-13. The enrolment in schools has also increased considerably.
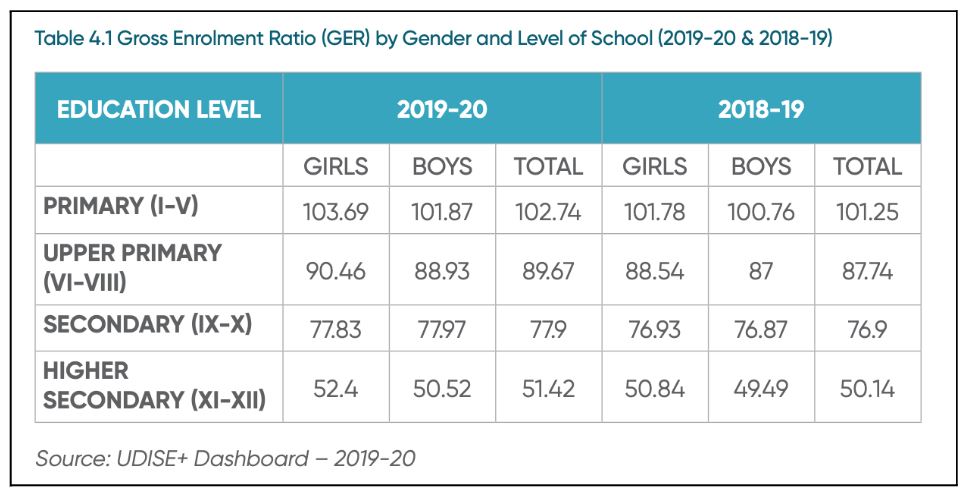
Along with this improvement in physical infrastructure, there is an improvement in the representation of females in schools. The Gender Parity Index (GPI) was more than 1 across all levels of education at an all-India level. However, there is a considerable variation among the states. Ensuring access to education, across all socio-economic and religious categories will bridge the knowledge gap, and thereby inequality.
Household Characteristics
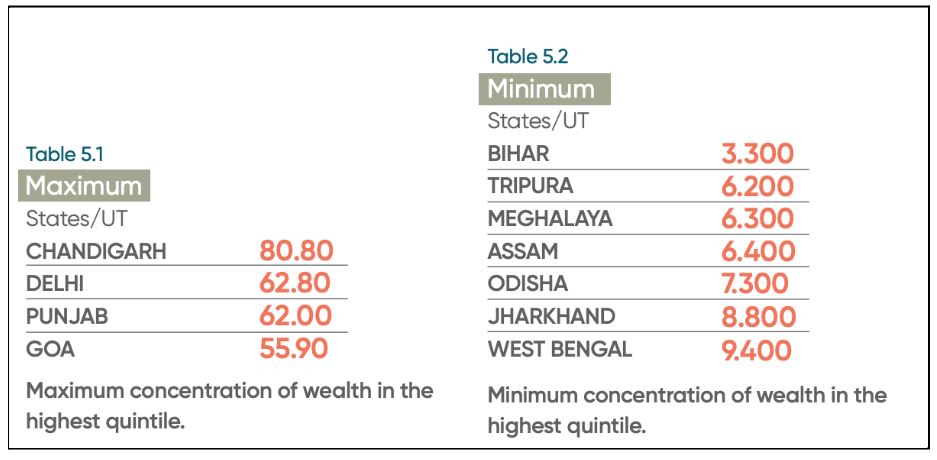
The household characteristics provide insight into the everyday experiences of poverty and living standards. The consumption capacity of a household determines whether they must make choices between the needs to run the household. Among the characteristics, wealth concentration and asset ownership are important. In urban areas, 44.4% wealth concentration is found in the highest quintile, while it is only 7.1% in rural areas. There is an inter-state variation in the concentration of wealth in the highest quintile.
In terms of households with mobile phones, 87% in rural areas, and 96% in urban areas own mobile phones. In land-owning, around 88% of non-agricultural land is held in urban areas and 47% in rural areas. The access to improved drinking water sources at an all-India level increased from 94.4% in 2015 to 95.9% in 2020. Households with clean cooking fuel also jumped from 43.8% in 2015-16 to 58.6% in 2019-21.
Targeted interventions like the Jal Jeevan Mission, and Swachh Bharath Mission seem to have brought significant improvements in household characteristics. It is important to undertake more such proactive targeted interventions.
What does the report recommend?
The report studies the above mentioned four parameters to understand the idea of inequality in India comprehensively. In addition to this, the report provides some key recommendations for the future:
- Increase Minimum Income Levels and introduce Universal Basic Income.
- Initiate an urban equivalent of MNREGS to absorb the excess labour and their rehabilitation.
- Allocate more expenditure towards the social sector and welfare schemes for the poor.
- Ensure equitable access to education and job creation for initiating upward mobility.
- Government must initiate regular exercises for assessing the extent of vulnerability among households and chart out action plans to promote their well-being.
Inequality in India – An overview of other reports:
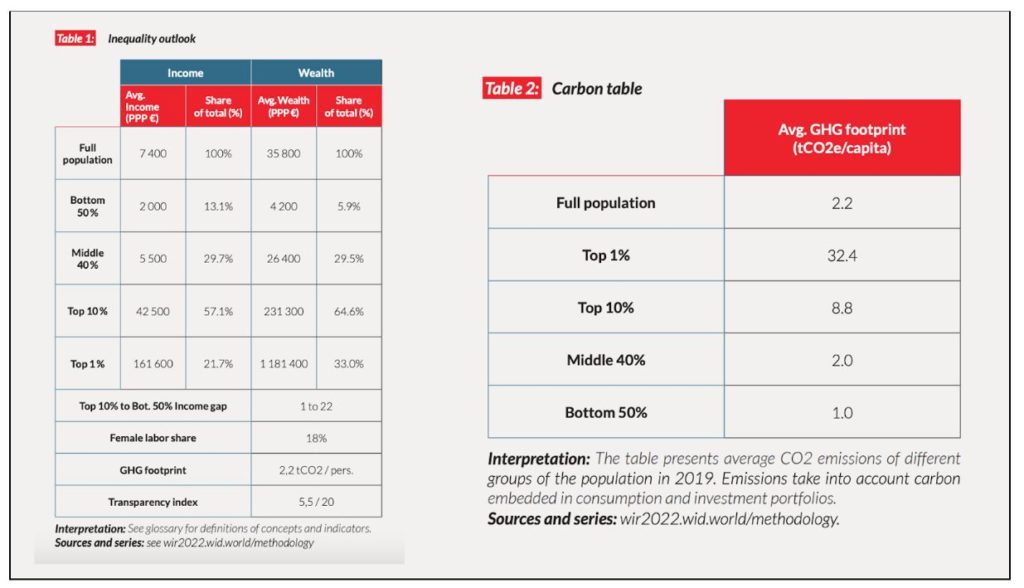
The World Inequality Report 2022 by the world inequality Lab, presents a key overview of inequality across the globe. This inequality report considers a variety of factors like wealth inequality, gender inequality, carbon inequality and income equality. The report points out that India is a poor but a very unequal country. The reforms of economic liberalization have benefitted the upper and middle classes more than the lower classes. The report stresses that in the past three years, the quality of inequality data released by the government has become deteriorated, making it difficult to ascertain the level of inequality in India.
The world inequality report ranks India as one of the most unequal countries in the world. The ratio between the top 10% to the bottom 50% income gap stands at 22, making it among the most unequal countries. India also scores very less in the transparency index, with a score of 5.5 out of 20. In its carbon inequality, the report observes that India is a low carbon emitter, with an average per capita consumption of greenhouse gases of 2 Tonnes of carbon dioxide equivalent (tCO2e). However, the top 1% emit more than the bottom 90%.
This report, along with the state of inequality in India, indicates a worrying level of inequality in India. In an already layered Indian society, this level of inequality and its increasing tendency can have dire consequences. Hence, it is imperative for governments to initiate measures to reverse the direction.
Featured Image: World Inequality Report 2022

