
NITI Aayog recently published a policy report titled ‘Expanding Quality Higher Education through States and State Public Universities’. Among other things, the report highlights the financial, academic, governance & employability challenges of these universities and makes important recommendations.
In the previous story, we analysed the trends in the growth of the education sector and higher education since the time of Independence, based on the National Institute of Transforming India’s (NITI Aayog) policy report titled Expanding Quality Higher Education through States and State Public Universities. It was observed that as of 2021-22, though State Public Universities (SPUs) account for only 36% of Higher Education Institutions (HEIs), they account for 81% of students pursuing higher education in the country.
In this story, we look at the state-wise number and density of SPUs, the enrolment trends in different types of courses of study offered by them, together with the key issues noted in the report and the recommendations made.
SPUs are not distributed uniformly across states
As per the report, there are about 495 SPUs in India, as of January 2025. They have increased by 50% over the last 14 years. Despite the increase in number, their distribution, akin to other universities offering higher education, is uneven across States and Union Territories (UTs). The northeastern states of Mizoram, Nagaland, and UTs of Andaman & Nicobar Islands, Lakshadweep, Daman & Diu, and Dadra & Nagar Haveli do not have a single SPU as yet. Karnataka leads with 43 SPUs, followed by West Bengal (WB) and Uttar Pradesh (UP) with 38 each.
In terms of university density, calculated as the number of SPUs per lakh eligible population in the age group of 18-23 years, the states of Karnataka, WB, and UP had only 0.5, 0.3, and 0.1 SPUs, respectively. Ladakh had the highest density with 2.6 SPUs, followed by Sikkim (1.1), Himachal Pradesh (0.9), Manipur (0.8), and Uttarakhand (0.9). The large states in terms of population had lower densities. Bihar had the lowest with 0.1 SPUs, followed by Jharkhand, Madhya Pradesh, and Maharashtra with 0.2 SPUs each.
Between 2011-12 & 2021-22, over 85% of enrolments in SPUs are in Under Graduate courses
In terms of enrolments in SPUs by level of education, between 2011-12 & 2021-22, the enrolments in Under Graduation (UG) were consistently way higher than all the other levels of education, and understandably so. In 2011-12, they accounted for 86% (202 lakhs out of a total of 234 lakhs) of enrolments in all levels of education. In 2016-17 and 2021-22, they accounted for 86% and 85%, respectively.
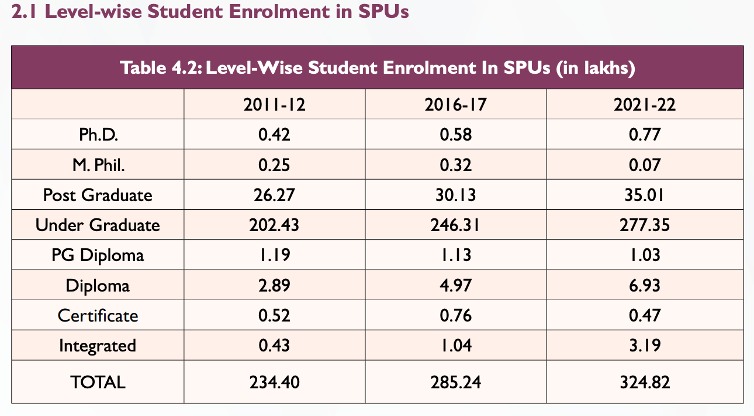
The data also indicates a significant rise in Ph.D. enrolments, with a 39% increase from 2011-12 to 2016-17, followed by a 33% growth from 2016-17 to 2021-22. Postgraduate (PG) enrolments also showed steady growth, increasing by 15% in the first period and 16% in the latter, which as per the report reflects a sustained interest in higher studies.
In contrast, UG enrolments, despite growing by 22% between 2011-12 and 2016-17, saw a slower rise of 13% from 2016-17 to 2021-22. This decline in growth rate may be attributed to increased access to alternative career paths, vocational training opportunities, and evolving employment landscapes.
Diploma courses experienced remarkable growth, with enrolments increasing by 72% between 2011-12 and 2016-17, and continuing with a 39% increase in the following five years. This trend suggests a growing preference for alternative certification and skill-based training outside traditional higher education.
However, PG diploma enrolments declined by 5% from 2011-12 to 2016-17 and further dropped by 9% between 2016-17 and 2021-22. The report states that this trend potentially signals the emergence of alternative training and certification pathways outside the formal higher education system.
Enrolments in Teaching departments and Constituent Units/Off-campus Centres affiliated to State Private Universities exhibit rapid growth
To analyse enrolment trends in higher education, the report examined data from Teaching Departments and Constituent Units/Off-campus Centres of SPUs and other universities. Enrolment in these units of the SPUs increased from 24.5 lakh in 2011-12 to 29.8 lakh in 2021-22, reflecting a decadal growth rate of 21.8%. However, growth slowed to 7.9% between 2016-17 and 2021-22.
In comparison, State Private Universities saw a remarkable increase in enrolments, surging from 2.7 lakh in 2011-12 to 16.2 lakh in 2021-22, marking a 497% increase. The growth rate between 2016-17 and 2021-22 alone stood at 110%. For Central Universities, enrolments grew from 5.5 lakh in 2011-12 to 7 lakh in 2021-22, recording an overall growth rate of 26.4%. However, they experienced a 2.5% decline in growth rate between 2016-17 and 2021-22.
Like State Private Universities, Private Deemed Universities and other institutions also witnessed substantial enrolment growth over the decade.
Enrolment Growth Rates in Teaching Departments, Constituent Units & Off-Campus Centres of Different Universities
| University Type | Between 2011-12 & 2021-22 | Between 2016-17 & 2021-22 |
| State Public Universities | 21.8% | 7.9% |
| State Private Universities | 497% | 110% |
| Central Universities | 26.4% | -2.5% |
| Private Deemed Universities | 54.5% | 39.3% |
| Others | 106.1% | 57.7% |
Source: Expanding Quality Higher Education through States and State Public Universities
The report observed that these trends in enrolment indicate the dynamic nature of India’s education landscape. While the SPUs were dominant in absolute enrolment figures, the State Private Universities exhibited the most rapid growth trajectory.
However, the declining enrolments in the Central Universities could be indicative of potential shifts in student preferences or institutional capacity constraints.
As of 2020-21, states spent an average of 2,454 crores on Higher Education
The report highlights a decline in the share of education spending by states as a percentage of Gross State Domestic Product (GSDP) between 2005-06 and 2019-20. Additionally, the growth rate of higher education expenditure has also declined.
While the median value of average growth rates in higher education expenditure was 10% during both 2005-10 and 2010-15, it declined to 6.6% in 2019-20. Furthermore, the report notes that despite the 14th Finance Commission’s recommendation to increase central tax devolution to states from 32% to 42%, this shift has not led to a corresponding rise in education spending across states.
As of 2020-21, the average budget allocated for higher education was Rs. 2,454 crores across states. Maharashtra had the higher budget with Rs. 11,421 crore, followed by Bihar (Rs. 9,666 crore), and Tamil Nadu (Rs. 7,237 crore). Less-populated states like Sikkim (Rs. 142 crore), Arunachal Pradesh (Rs. 155 crore), and Nagaland (Rs. 167 crore) had the lowest higher education budgets.
In terms of higher education expenditure as a percentage of SGDP, Bihar was the highest with a share of 1.56%. It is followed by Jammu and Kashmir with 1.53%, and Manipur with 1.45%. Telangana had the lowest percentage with 0.18%, while Gujarat and Rajasthan had 0.23% each.
In terms of total education expenditure as a percentage of GSDP, Jammu & Kashmir led with 8.1%, followed by Manipur (7.2%), and Meghalaya (6.6%). Delhi (1.6%), Telangana (2%), and Karnataka (2%) were the lowest.
Report notes key issues hindering progress of SPUs and the enrolments
By taking stock of these trends in increase in number of SPUs, enrolments in different types of education, finance, and other pertinent aspects, the report conducted a survey with several stakeholders. The key issues and recommendations made in this report are provided below.
Key Issues noted
- Quality of Education
- Lack of adequate infrastructure, research facilities, and funding.
- Faculty shortage and misalignment between teaching and research roles.
- Low enrolment in advanced degrees, affecting research capacity.
- Inadequate access to high-quality research journals and advanced research instruments.
- Limited industry collaboration, hindering applied research initiatives.
- Funding & Financing
- Over-reliance on traditional revenue streams such as admission fees and state grants.
- Limited financial autonomy for SPUs to raise fees or secure additional funding.
- Absence of a dedicated infrastructure finance agency for SPUs.
- Delayed disbursement of research grants affecting ongoing projects.
- Governance Challenges
- Inefficiencies in the affiliation process for colleges.
- Lack of transparency in faculty and staff appointments.
- Frequent leadership changes at the Vice-Chancellor level, impacting stability.
- Bureaucratic hurdles in admissions, examinations, and financial approvals.
- Limited autonomy for affiliated colleges due to centralized state control.
- Employability & Industry-Readiness Issues
- Limited industry-academia collaboration in curriculum development.
- Lack of adequate internship and apprenticeship programs.
- Inadequate mentorship and participation from industry professionals.
- Deficiency in students’ employability skills, particularly in communication and practical knowledge.
Key Recommendations made
- Enhancing Quality of Education & Research
- Implement a National Research Policy to standardize research frameworks and funding mechanisms.
- Promote collaborative research hubs to encourage interdisciplinary projects.
- Increase R&D investment to 2% of GDP, aligning with economic survey recommendations.
- Improve access to high-quality research journals and establish dedicated research funds for SPUs.
- Strengthening Funding & Financing
- Increase education investment to 6% of GDP, as per NEP 2020.
- Develop alternative revenue streams such as alumni donations, endowments, and CSR funding.
- Allow SPUs greater fee autonomy to ensure financial sustainability.
- Establish an Infrastructure Finance Agency dedicated to SPUs.
- Governance Reforms
- Streamline faculty recruitment and introduce merit-based hiring systems.
- Improve administrative autonomy for SPUs and reduce bureaucratic delays.
- Encourage synergy between Technical and Higher Education Departments to avoid duplication of efforts.
- Address leadership stability by limiting frequent VC changes.
- Enhancing Employability & Industry Linkages
- Strengthen internship and apprenticeship programs with structured credit systems.
- Establish “Internship Banks” to connect students with industry placements.
- Promote Professor of Practice positions to involve industry experts in teaching.
- Foster global partnerships to improve students’ language skills and job readiness.

