Recently, the CAG released its fifth report on compliance of FRBM Act, 2003, for the year 2019-20. The numbers in the report though from the period before the onset of the COVID-19 pandemic paint a grim picture of the debt situation. We look at the key findings & observations from this report of the CAG.
The Union Government incurs expenditure of various sorts including welfare schemes, subsidies, infrastructure development & maintenance, and administrative expenditure. This expenditure is met through different sources of income. In the annual budget, the government makes estimates for expenditure & earnings through various revenue sources that include tax and non-tax revenues. Any shortfall in the revenue to meet the expenditure is met through borrowings. These borrowings are a liability that the government must pay back. In a recent story, we highlighted the increasing trend of market borrowings by the Union government to meet its expenditure, which increased significantly in the light of COVID-19.
While borrowings help governments tide over the fiscal deficit i.e., the excess of expenditure over the revenue, it does not augur well for the longer-term economic stability of the country.
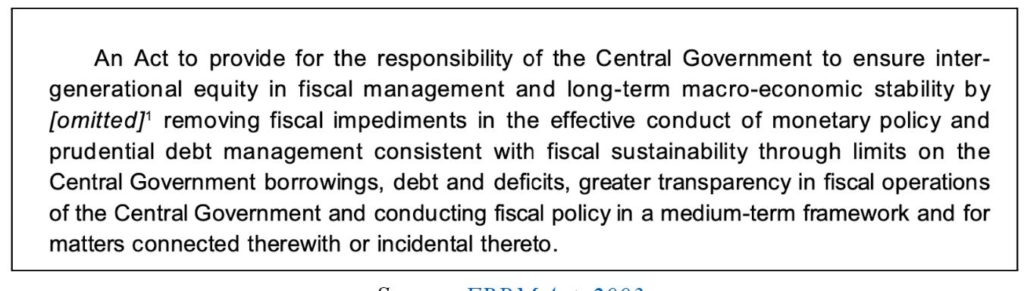
To ensure better fiscal management and introduce fiscal discipline, the Government of India enacted Fiscal Responsibility and Budget Management (FRBM Act, 2003).
Section 7A of the FRBM Act, introduced through an amendment in 2012, entrusted the Comptroller and Auditor General of India (CAG) to conduct a periodical review of the compliance with this Act by the Union Government, starting from 2014-15. Recently, the CAG released its fifth report on compliance with the FRBM Act, 2003, for the years 2019-20. We look at the key findings & observations from this report of the CAG.
One of the Key Targets of the FRBM Act is to limit the Fiscal Deficit to 3% of GDP
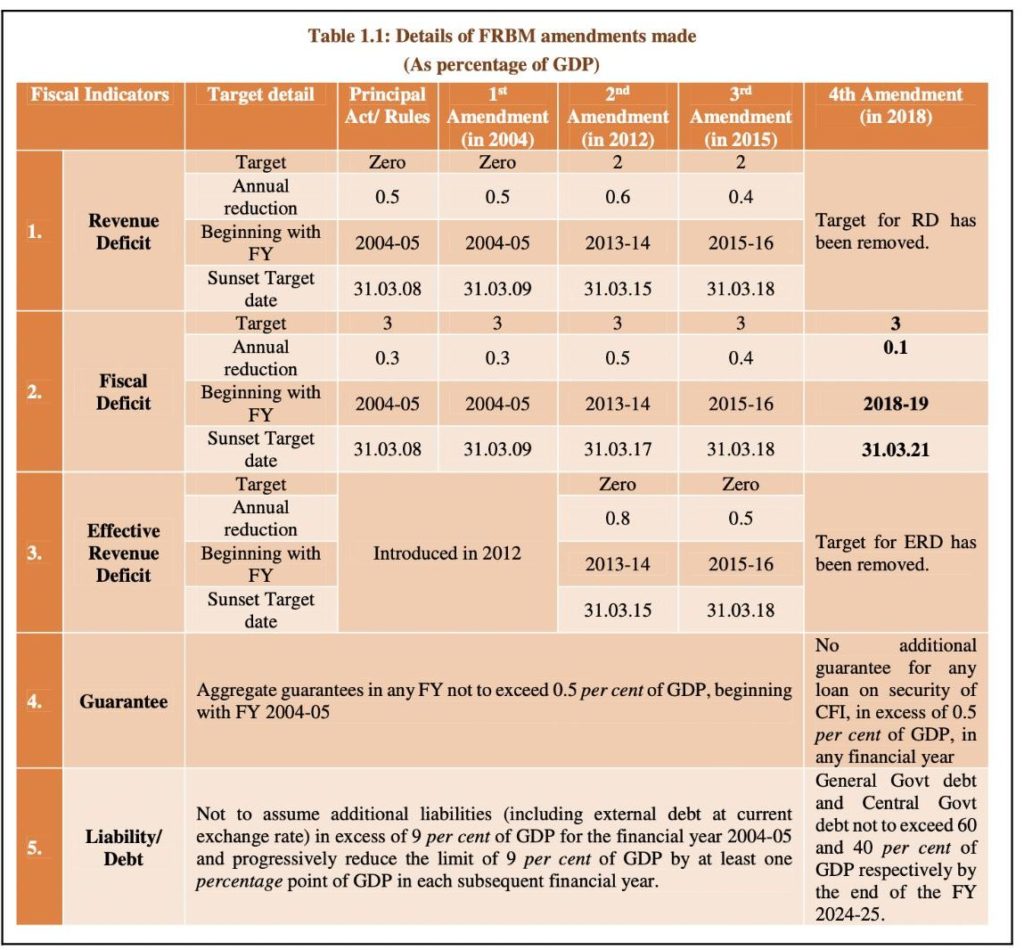
Since the enactment of the FRBM act in 2003, it was amended 4 times – 2004, 2012, 2015 & 2018. The FRBM Act and the Rules underwent more significant changes during the 4th Amendment, in 2018.
In these amendments, the target for Revenue Deficit (difference between Revenue Expenditure and Revenue Receipts) and Effective Revenue was Removed.
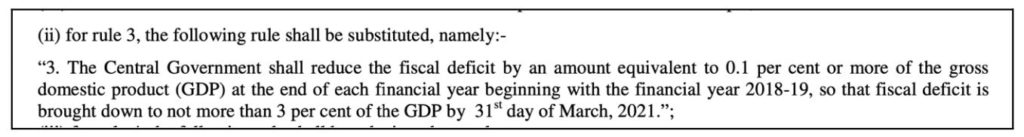
The target of limiting the Fiscal Deficit at 3% of GDP is extended with a target date of 31 March 2021. It targeted to reduce the Fiscal Deficit by 0.1% every year to reach the fiscal deficit target of 3%.
The other target is to ensure that by the end of 2024-25, the General Government debt does not exceed 60% of GDP and Central Government Debt does not exceed 40% of GDP. The FRBM rules also state that no additional guarantees for any loan or security of the Consolidated Fund of India (CFI) in excess of 0.5% of GDP in a Financial year.
The latest CAG report on Compliance of the FRBM Act, 2003 is the second report after the 2018 amendment was made effective on 01 April 2018.
Fiscal Deficit at 4.6 % of GDP in 2019-20, as per the CAG report
As highlighted, one of the key targets under FRBM is to reduce the Fiscal Deficit to equal to or less than 3% of GDP by 2020-21. The annual reduction target was 0.1%. Therefore, the target for 2019-20 was 3.3% of GDP.
The CAG report refers to the information from the Ministry of Statistics & Programme Implementation, where-in the GDP for the year 2019-20 was around Rs. 200.7 lakh crores. As per the Budget at Glance Report (BAG), the fiscal deficit for the year was Rs. 9.33 lakh crores. This accounts for 4.65% of the GDP for the year. CAG report also refers to the information from the Union Government Finance Accounts (UGFA), where the fiscal deficit for the year was mentioned as Rs. 10.31 lakh crores i.e., 5.14 % of the GDP. The difference between the Fiscal Deficit of BAG and UGFA is due to the exclusion of certain expenses on capital infusion for Public Sector banks, external assistance for State Government projects and other expenses.
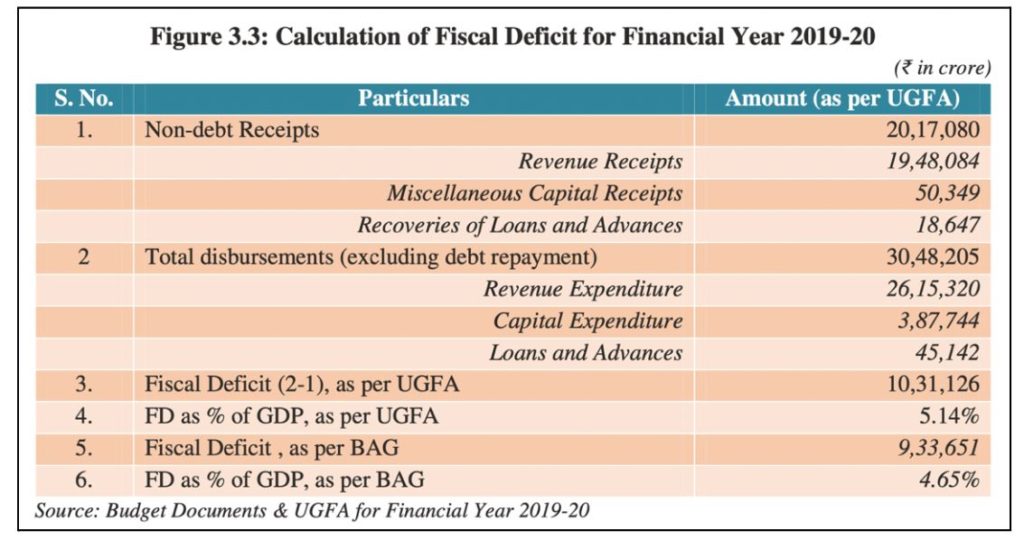
The FD in the earlier two years i.e., 2017-18 and 2018-19 was 3.5% and 3.4% respectively, indicating a jump in the FD for 2019-20. The GDP grew from Rs. 189.71 lakh crores in 2018-19 to 200.7 lakh crores in 2019-20. Meanwhile, the total expenditure increased from Rs. 23.15 lakh crores in 2018-19 to Rs. 30.48 lakh crores in 2019-20. During the same period, the non-debt receipts increased from Rs. 16.65 lakh crores to Rs. 20.17 lakh crores, i.e., the increase in expenditure was higher than the increase in non-debt receipts. Therefore contributing towards a higher increase in fiscal Deficit.
As per the latest budget documents for 2022-23, the actual Fiscal Deficit for 2020-21, increased to 9.2% of GDP. The impact of the COVID-19 pandemic is clearly visible, where-in, the non-debt receipts were only Rs. 16.91 lakh crores i.e., lower than the previous year. Meanwhile, the expenditure increased to Rs. 35.09 Lakh crores. The total FD for the year was Rs. 18.18 lakh crores. The increase in fiscal deficit was at the time when the GDP fell for the year. As per the information available with MoSPI, the GDP for 2020-21 was Rs. 198.01 lakh crores. This also implies that the FRBM target of limiting Fiscal Deficit to 3% of GDP by 2020-21 is not met. The target might also not be met for the next few years if one goes by the figures for the subsequent years.
The revised estimates for 2021-22, project an improvement over the previous year, yet a higher fiscal deficit of 6.9% of GDP while the budget estimates for 2022-23 peg the fiscal deficit at 6.4% of GDP. The overall trend indicates that there was an improving trend in the Fiscal Deficit to GDP ratio, until 2018-19, after which it took an opposite turn.
Central Government Debt at 52.3% of GDP in 2019-20
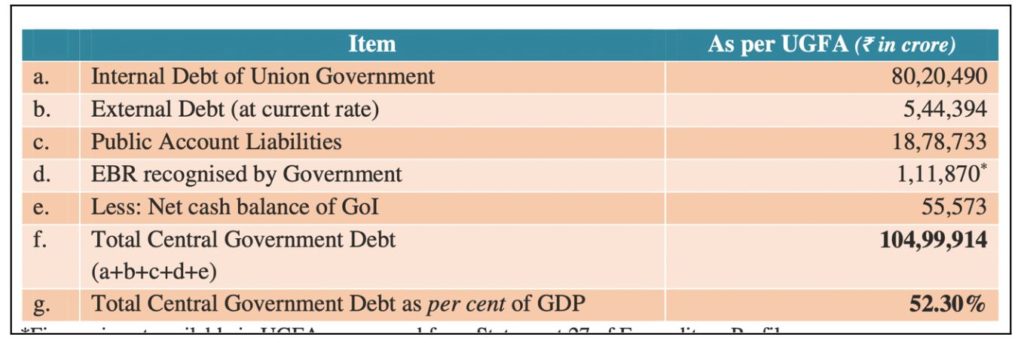
The amendments made to FRBM in 2018, introduced new targets of – Central Government Debt not to cross 40% of GDP and General Government Debt not to cross 60% of GDP by 2024-25. Central Government Debt includes – Total outstanding liabilities on the security of CFI, total outstanding liabilities in the Public Account of India and the financial liabilities of any of the central government bodies.
As per the CAG report, based on the reference of UGFA, the total Central Government Debt in 2019-20 was Rs. 104.99 lakh crores. This accounts for 52.3% of the GDP. As highlighted, the target to be achieved by 2024-25 is 40% of GDP.
CAG reports note that the target can be achieved by 2024-25, with superior growth in GDP. However, as already highlighted above, there has been a fall in the GDP for 2020-21, compared to 2019-20. This also corresponds with an increase in the debt borrowings of the centre which pushes the Central Government debt to GDP ratio higher.
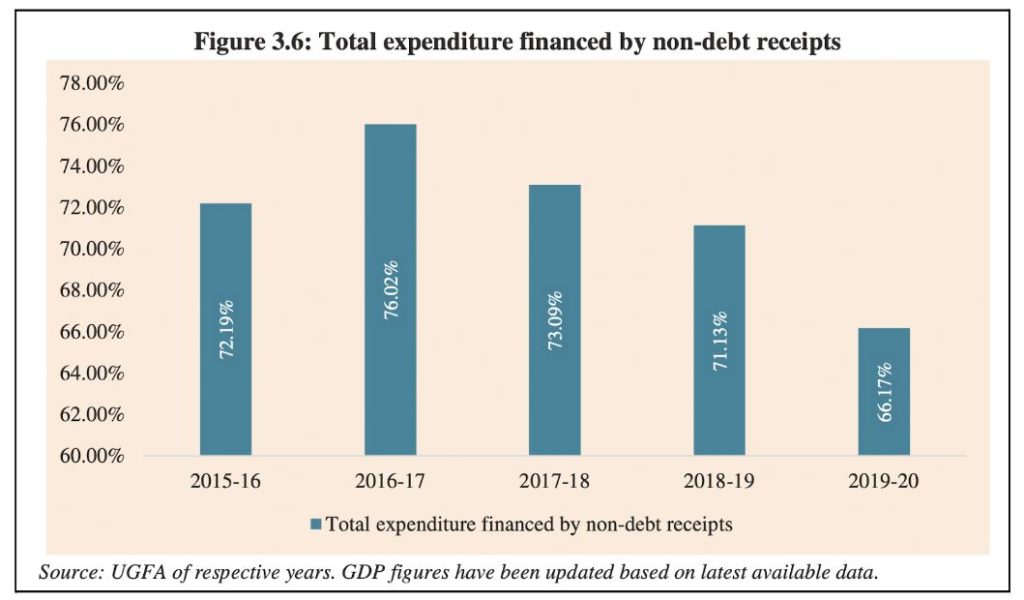
Data indicates that there is a declining trend of Union Government meeting its expenditure through non-debt receipts. In 2016-17, it was 76.02% and in 2019-20 it reduced to 66.17%. This implies that the government relies on debt receipts to meet its expenditure. As highlighted in an earlier story, there is a fall in Union’s tax & non-tax revenues and an increased reliance on borrowings.
Another target is to reduce the General Government Debt to less than 60% by 2024-25. General Government Debt is the total debt of the Central Government and the State government. CAG report refers to Status Paper on Government Debt, as per which the General Government Debt at the end of 2018-19 was 68.6% of GDP. As per the finance ministry’s response in February 2022, the status paper for 2019-20 is in progress.
If the numbers of the subsequent years are any indication, this target would be missed in view of the increasing debt situation of the States. Our story on increasing reliance on borrowings by the States to meet the expenditure can be read here.
The increase in the Debt to GDP ratio also impacts another indicator – Debt Sustainability Indicator. Debt sustainability is defined as the ability of the government to maintain constant Debt to GDP ratio. Debt to GDP ratio increases because of higher levels of debt leading to higher interest expenditures, contributing to higher deficits. In contrast to the trend between 2015-16 to 2018-19, the debt sustainability indicator was negative i.e., more burden on the union government.
Trends indicate that the Union government is far off from meeting the FRBM goals.
The Fiscal deficit and other debt indicators are a reflection of the economy. Lower revenue receipts in the backdrop of increasing expenditure are a direct contributor to Fiscal Deficit. The already increasing trend of fiscal deficit & higher debts was further exacerbated by the COVID-19 pandemic. During the pandemic years, the GDP fell, and the growth was stymied coupled with increased expenditure.
The fall in GDP during the pandemic year and slower than expected growth in the ensuing years contributed to a higher Fiscal Deficit. The projections for even the current year, which is two years past the deadline of 2020-21, are more than double the goal of 3%.
Featured Image: CAG report on compliance of FRBM act

