[orc]In part-2 of this series on the performance of SRTUs, we look at the employee strength, their productivity, accidents involving SRTU buses among other things.
Among other demands put forth by the striking employees of TSRTC, they have also asked the Telangana government to revise their pay scales, purchase more buses and recruit more people. This story is the second part of the three-part series on performances of SRTUs in India. In the first part, we looked at the fleet size, passengers, productivity and other such parameters. In this story, we look at staff strength, productivity and accidents that have taken place across SRTUs.
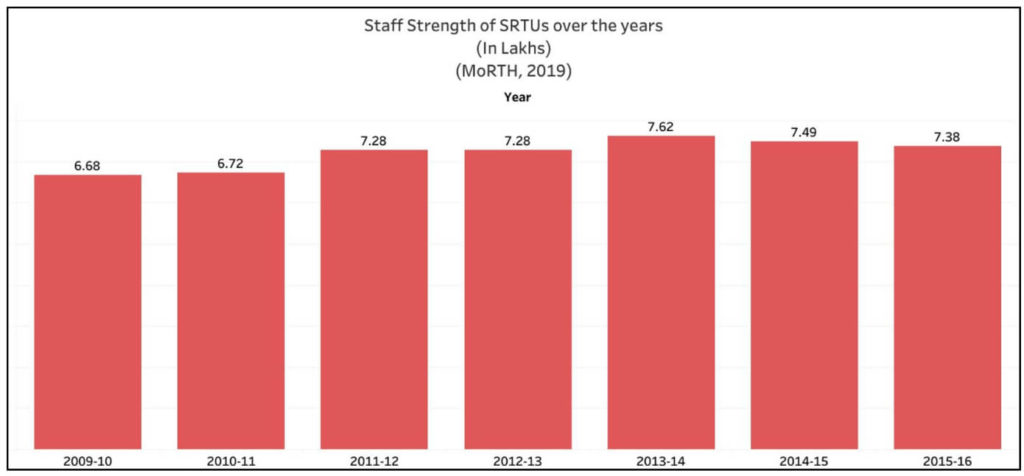
Total staff strength of SRTUs has declined by 3% since 2013-14
SRTUs have provided employment for more than 7.38 lakh people in the country as of 2015-16. The number has fallen by about 3% compared to the 7.62 lakh employed in 2013-14. Maharashtra SRTC which has the largest number of buses is also the largest employment provider. It had more than 1 lakh employees in 2015-16 which accounted for 14% of the total SRTU employment. Andhra Pradesh SRTC which has the second-largest fleet size in India had a staff strength of 57,902 followed by Telangana SRTC with a staff strength of 55,993 constituting 7.5% of total staff strength as of 2015-16.
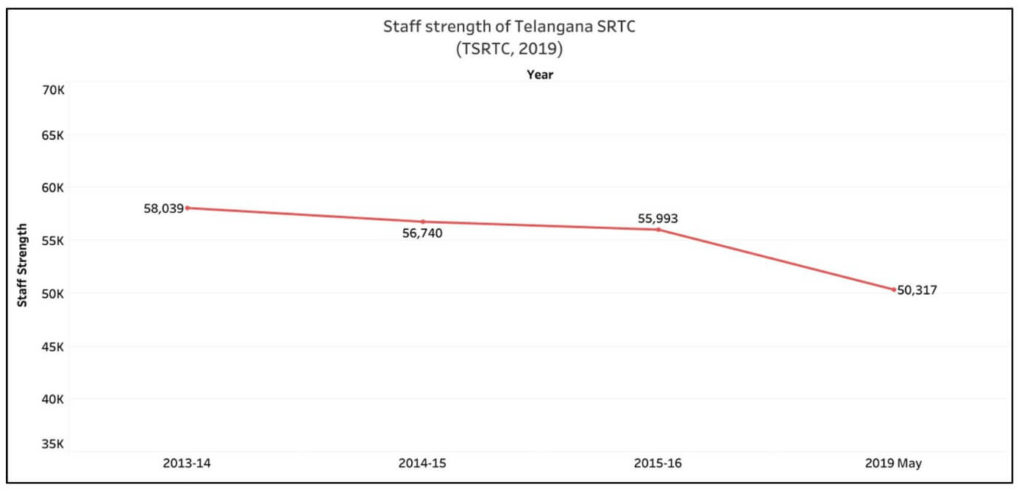
TSRTC has witnessed a reduction in staff strength by more than 7,700 since 2009-10
In the case of TSRTC, the staff strength has been reducing since 2013-14. While in 2013-14, data suggests that it had provided employment for 58,039 people, in the following year 2014-15, the employee strength decreased to 56,740 people. This had further reduced to 55,993 in 2015-16. The latest staff strength, according to the TSRTC’s website is 50,317 as of May 2019. In the span of five years, the staff strength of TSRTC has gone down by 13%.
Not only TSRTC, but other SRTUs such as Andhra Pradesh SRTC, BEST Undertaking, Delhi TC, Kerala SRTC and UP SRTC have also witnessed a significant reduction in staff strength during this period.
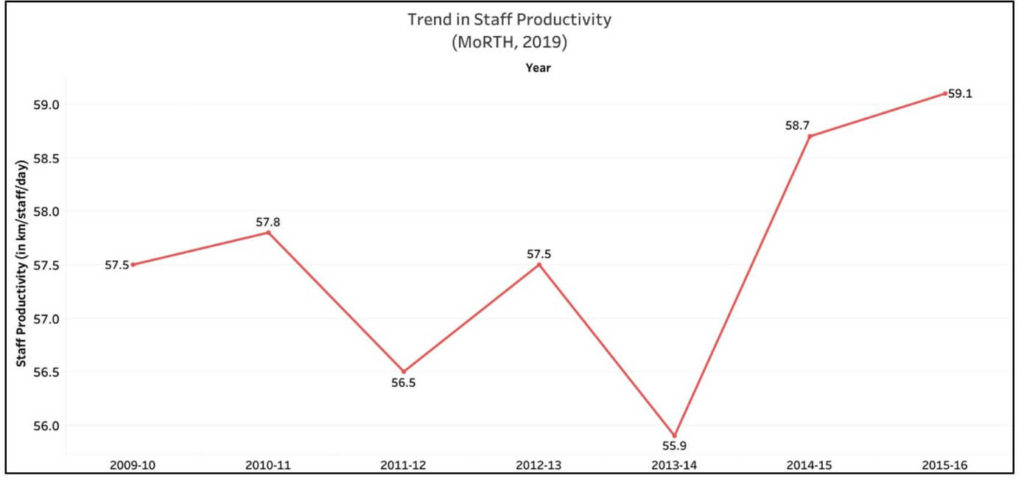
Staff productivity of SRTUs in India stood at 59.1 km per staff per day
Staff productivity is another parameter which is used in evaluating the performance of SRTUs. It is calculated as the average revenue-earning kilometres performed per worker per day. This parameter tell us how productive the staff is. From 55.9 km per worker per day in 2013-14, the productivity of staff has increased from to 59.1 km per worker per day in 2015-16. This may be attributed to the reduction in the employee strength and the increased passenger kilometres clocked by these SRTUs.
TSRTC has a staff productivity of 60.42 km per worker per day. Productivity of TSRTC is greater than the national average and has consistently remained so during this period.
Staff-Bus ratio of India has gone down implying that staff recruitment has not increased
The number of staff for each bus is represented by the parameter staff- bus ratio. The staff- bus ratio of India was 5.4 in 2012-13 and this dropped to 5.25 in 2014-15 and touched a low of 5.17 in 2015-16. This decrease could be attributed to reducing staff numbers and stagnant fleet size. TSRTC had a staff- bus ratio of 5.39 in 2015-16 less than that of 2014-15 when it stood at 5.49. In 2013-14, it was recorded as 5.64 in the case of TSRTC.
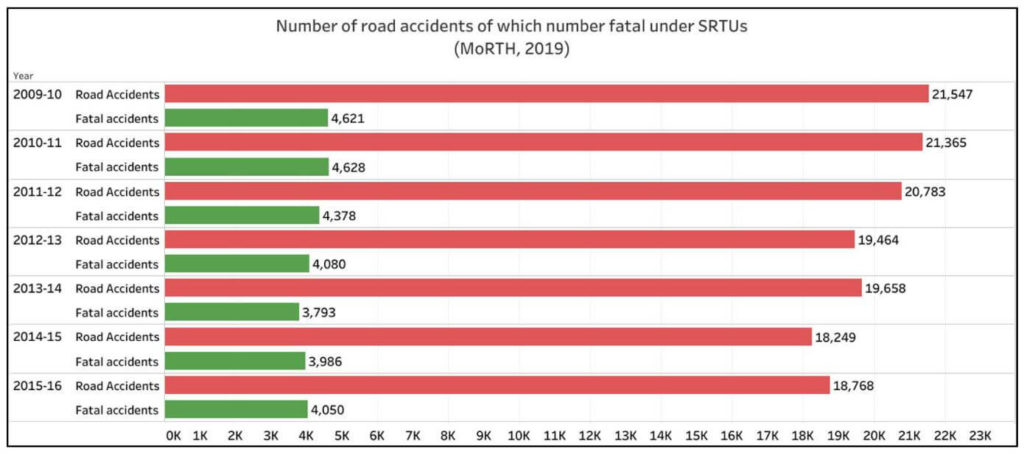
One in five accidents caused by buses under SRTUs results in fatality in India
While a total of 4,80,652 road accidents were recorded in 2016 alone, SRTU buses have been held responsible for 18,768 accidents in 2015-16. The number of cases of road accidents where buses of SRTUs are involved has come down by 12.8% between 2009-10 and 2015-16. But, on average, 21% of these accidents are fatal, which implies that one in five accidents caused by buses under SRTUs results in death. From 2013-14 to 2015-16, the number of fatal accidents has gone up even though the total number of accidents has come down.
42% of the accidents involving TSRTC buses have resulted in loss of lives
The highest number of accidents have been caused by the SRTUs in Maharashtra, Tamil Nadu, Karnataka, Kerala and Andhra Pradesh. In 2015-16, TSRTC buses were responsible for 827 accidents of which 348 or 42%, turned out to be fatal. The number of fatal accidents as the percentage of total number of accidents is the highest for Uttar Pradesh SRTC, with 53.8% of the total accidents turning fatal, followed by Tamil Nadu STC (Salem) Limited with 53.2% accidents resulting in fatalities. Haryana ST has the third-highest rate of fatal accidents with 46.7% while TSRTC is next in line with 42%.
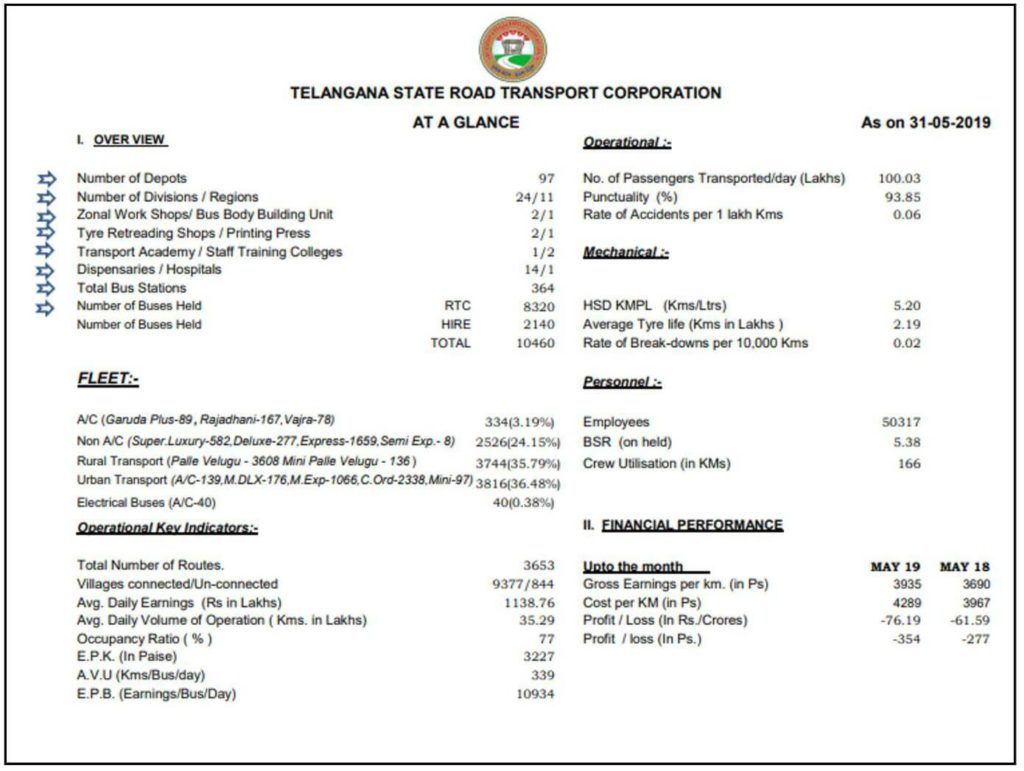
An overview of the performance of TSRTC is available on the official TSRTC website. A screenshot of the details as on 31 May 2019 is given below.
In part 3 of this series, financial performance of SRTUs will be covered.
Featured Image: By LOVEofZ [CC By SA 4.0]


3 Comments
Pingback: Part-2: Employee Strength of SRTUs decreased over the years - Fact Checking Tools | Factbase.us
Pingback: Part-3: Only about 10% of the SRTUs are profitable - Fact Checking Tools | Factbase.us
I am happy to find this post very useful for me