USA still remains the most popular destination for Indian students. The number of Indian students in USA crossed 2 lakh for the first time in 2018-19. Texas, New York & California remain the most preferred states for Indian students while more than 70% of them opted for STEM courses. Here is a detailed data story.
The Open Doors Report on International Education Exchange is an annual report which gives comprehensive information and data on the international students studying in the United States (USA). The 2019 report was released in November 2019. The number of international students in the US was the highest this year i.e. 2018-19.
This was the fourth year in a row where the number of international students in the USA was more than a million. However, the percentage increase in the total number of international students was the lowest in the since 2010, with a growth of just 0.05% in 2018-19 compared to 2017-18. There were 1,095,299 international students in US in 2018-19 as compared to 1,094,792 in 2017-18, a difference of 507 students. The number of international students had increased by more than 15,000 in 2017-18 resulting in a growth rate of 1.5%.
Asians account for more than 70% of the International students in the US
About 70.1% of the international students in the US are from Asian countries as per the latest report for 2018-19. Students from European countries comprised 8.3% whereas students from Latin America and Caribbean countries and from the Middle East and North Africa constitute 7.4% each. Sub- Saharan African students account for 3.7% of the total. North American students continue to constitute 2.4% of the total international students in the USA.
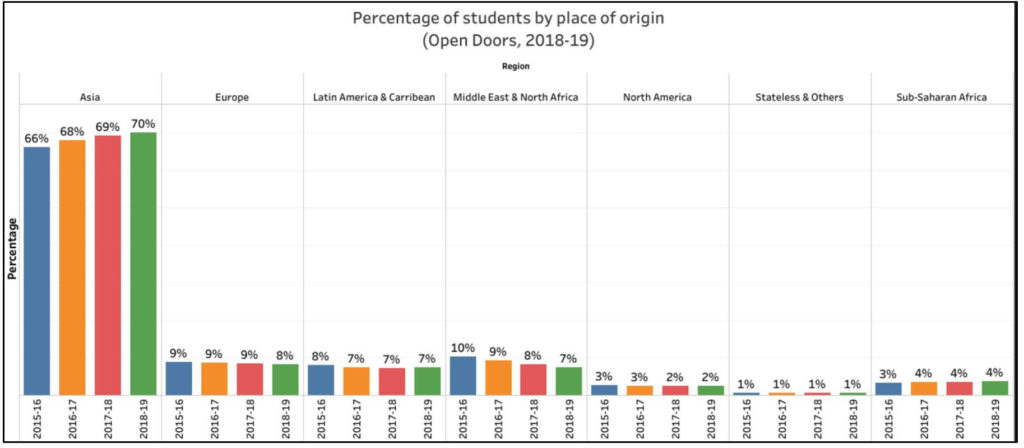
The share of international students from Asian and Sub- Saharan African countries have witnessed a gradual increase over the last 4 years. Meanwhile, the share of students from Europe and the Middle East & North African countries has witnessed a gradual decline over the same period.
India and China together account for 52% of the students
Students from two of the world’s most populous countries of China and India alone made up for more than 52% of the total number of international students. While China accounts for the maximum number of students with 369,548 students in USA, India accounts for the second-highest number of students with 202,014. In addition to India and China, there are 13 more countries which have more than 10,000 students each in USA in 2018-19.
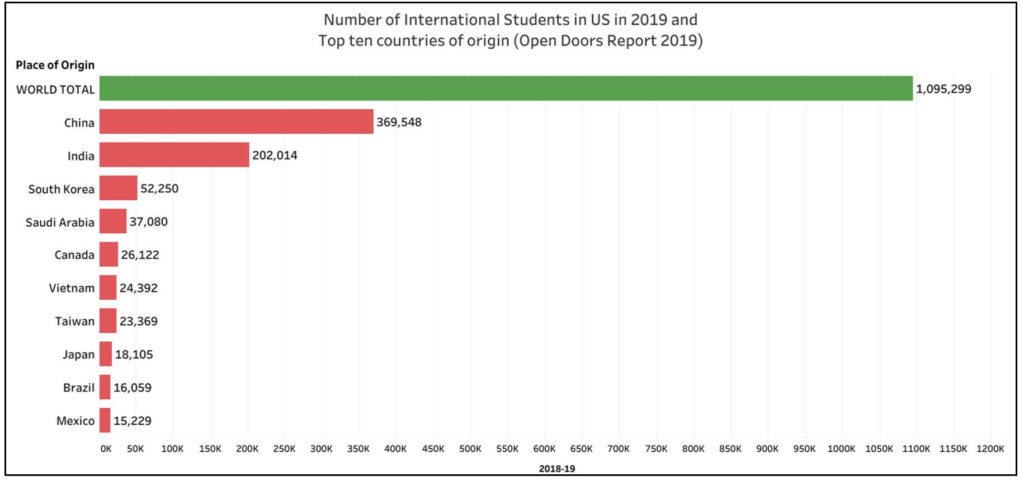
The top ten countries alone make up for almost 72% of the international students in the USA in 2018-19.
In 2018-19, the number of Indian students in the USA crossed 2 lakh
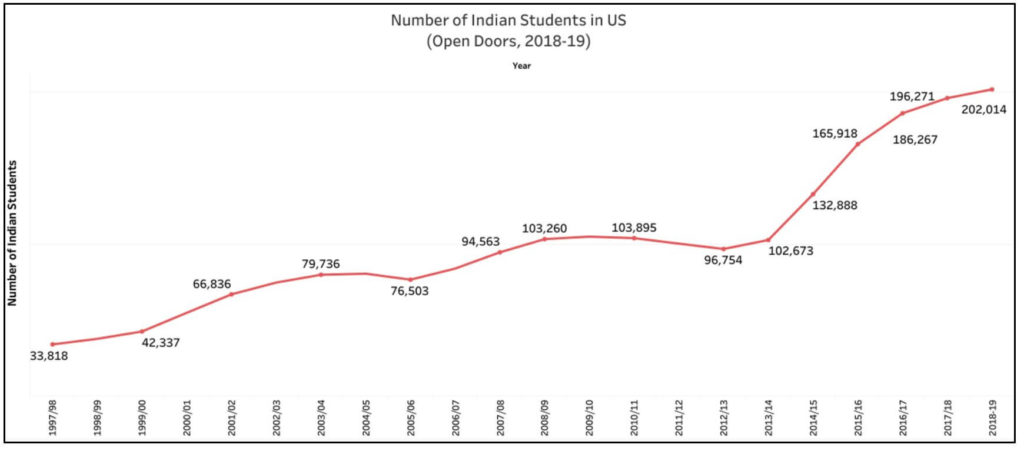
In 2018-19, it is observed that the percentage growth in the number of students from India is only 2.9%. This is the lowest such growth in five years. The three academic years between 2010 and 2013 witnessed negative growth. However, in 2014-15, the growth was almost 25%. Despite the lower growth in 2018-19, the number of Indian students in the USA crossed 2 lakh for the first time in 2018-19. Over the span of ten years from 2008-09 to 2018-19, the number of Indian students has almost doubled.
STEM courses continue to be the most in-demand in the USA
In terms of the field of study for which students go to the USA, more than 21% of the international students went to USA for Engineering courses and another 18.6% for Mathematics and Computer Science related courses. A total of 51.6% of the students had opted for STEM courses. Students who had opted for Business and Management courses accounted for 16.6%.
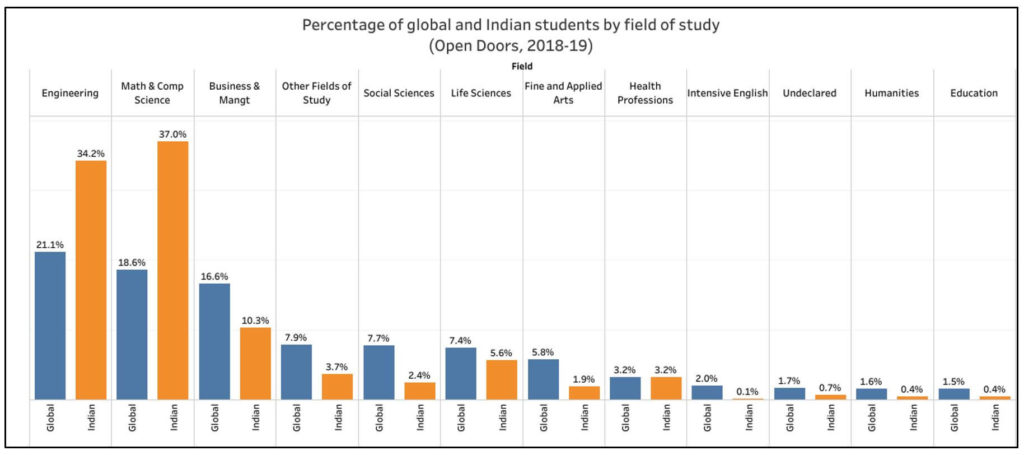
7 out of 10 Indian students are pursuing STEM courses in the US
In the case of Indian students, more than 70% of them had chosen STEM courses. STEM courses include Engineering, Mathematics and Computer Science courses. 37% of Indian students have taken Mathematics and Computer Science courses and 34.2% have chosen Engineering as compared to 37.5% in 2014-15. There is a gradual decline in the percentage of Indian students going to the USA for Engineering related courses.
Percentage of Indian students opting other courses is less than global average
In the case of other courses, the percentage share of Indian students who opted for a specific course is less than the global average. This includes fine and applied arts, humanities, business and management and social sciences among others. 10.3% Indians chose Business and Management courses while the global average was 16.6%.
Indian students alone accounted to 18% of total contribution to the US economy due to International students
According to the Open Doors Report, International Students contributed $44.7 Billion to the USA economy in 2018, 5.5% more than the previous year. Indian students in the US alone contributed $8.14 Billion in 2018-19. This is 18.2% of the total contribution of International Students.
Majority of the Indian students were in the USA for graduate-level education
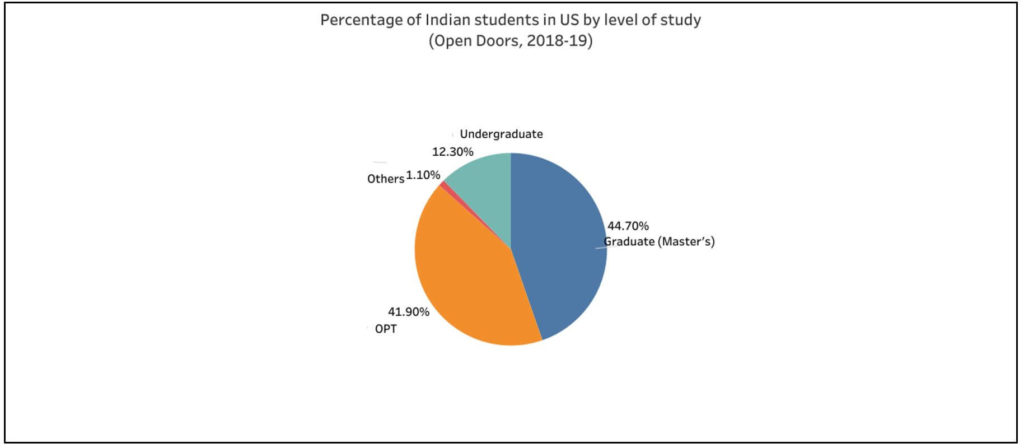
44.7% of the Indian students, more than 90,000 of them in USA in 2018-19 are at the graduate level (masters’). Since 2014-15, it can be observed that the percentage share of students going for masters’ is reducing while those in OPT has increased. OPT refers to Optional Practical Training which is a temporary employment complementing their education. Those who undergo the training are also considered students since they are under the visa sponsorship of the university/college even if they may have completed their course. As of 2018-19, 41.9% of Indian students were in OPT.
Indian students continue to prefer Texas, New York and California
While New York hosted 1.6 lakh, International Students, in 2018-19, the highest among states, it was the second most preferred state for Indian students. Texas continues to be the most preferred state for Indian students with more than 21,000 students choosing universities in Texas. New York also hosted more than 20,000 Indian students in 2018-19. California, Illinois and Massachusetts were the third, fourth and fifth preferred states for Indians, respectively. Only these three states had more than 10000 Indian students each in 2018-19.
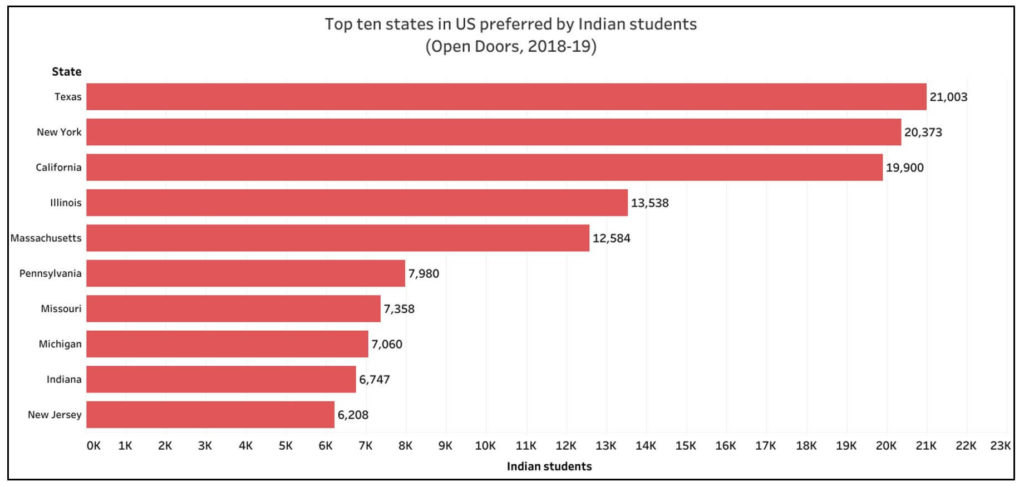
The top 10 preferred states for Indian students accounted for almost 61% of all Indian students in USA.
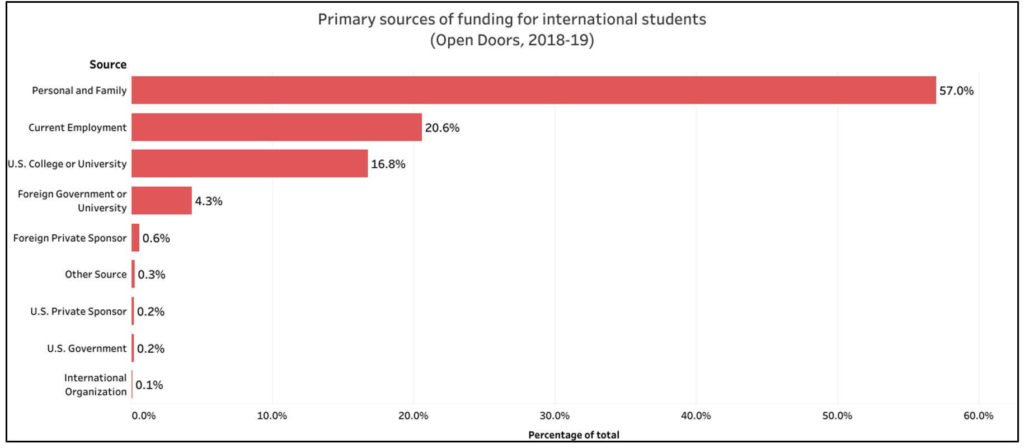
The primary source of funding for 57% of the international students was personal or family. 16.8% of the students were funded by US college or university. 20.6% were funded by their current employment. Further 4.3% were funded by foreign government or university. Only 0.7% students were funded by a foreign private sponsor.


