[orc]Life Expectancy at birth has increased from 60.7 years to 68.7 years in the 20-year period from 1994 to 2014. However, India still has a long way to go to attain SDG targets for parameters like IMR, MMR that influence life expectancy
The Ministry of Health and Family Welfare on 12 July 2019, presented numbers related to life expectancy in India as a response to the question raised in the Lok Sabha. In this story, we take a closer look at the numbers and region wise trends.
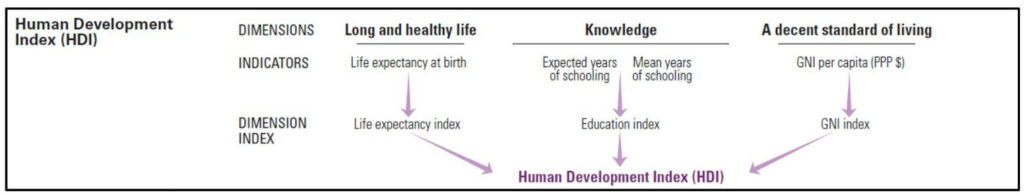
What is Life Expectancy at birth?
The main purpose of calculating the average life expectancy at birth is to ascertain the overall mortality level of a population. The number, as per the World Health Organisation (WHO) definition, shows the average number of years that a new born infant is expected to live if the current mortality rate continues to apply. This measure is also used to calculate the Human Development Index.
India ranks 125 out of 183 countries in terms of Average Life Expectancy at birth
The global average life expectancy at birth in the year 2016 was 72 years as per the WHO. Also, India currently ranks 125 of 183 countries in the world.
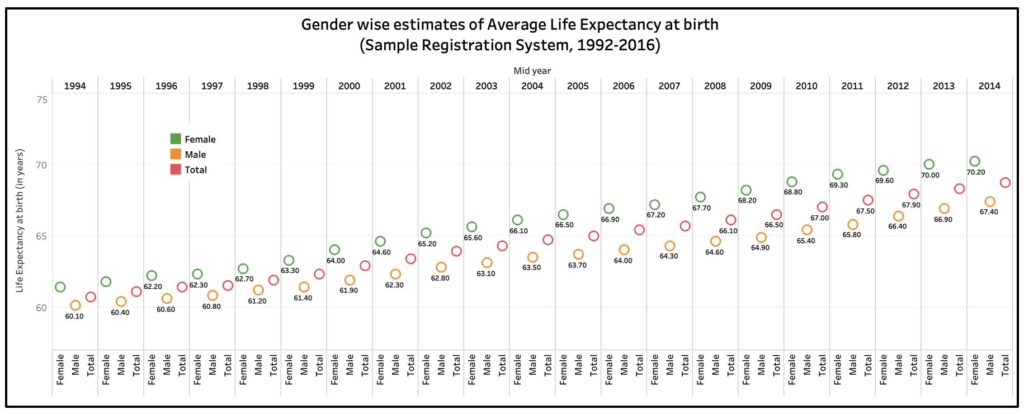
In India, during the 20-year period from 1994 to 2014, the life expectancy has improved substantially- from 60.7 years to 68.7 years, an increase of 13%. Further, it is clear from the data that life expectancy of females has always been higher than that of males. The life expectancy of males has increased from 60.1 to 67.4 years during this 20-year period while that of females has increased from 61.4 to 70.2 years over the same span. In other words, the life expectancy of males and females has increased by 7.3 years and 8.8 years respectively.
The ministry has attributed this to a combination of reduced infant mortality rate (IMR) and maternal mortality rate (MMR), increased immunisation against infectious diseases in childhood. In addition to this, improved housing conditions, sanitation, and access to education, better public health facilities, growing incomes and trend to have smaller families have also been highlighted as the reasons for this improvement.
Kerala has the highest life expectancy of 75.1 years while UP has the least- 64.8 years
Looking at the figures from each state for the period 2012-16, Kerala has the highest life expectancy at 75.1 years. The least is that of Uttar Pradesh where the life expectancy is only 64.8 years. Only six states- Kerala, Delhi, Jammu and Kashmir, Punjab, Himachal Pradesh and Maharashtra have the average life expectancy greater than 72 years, the global average. Since 1992, the average life expectancy of each state has improved, but by varied rates.
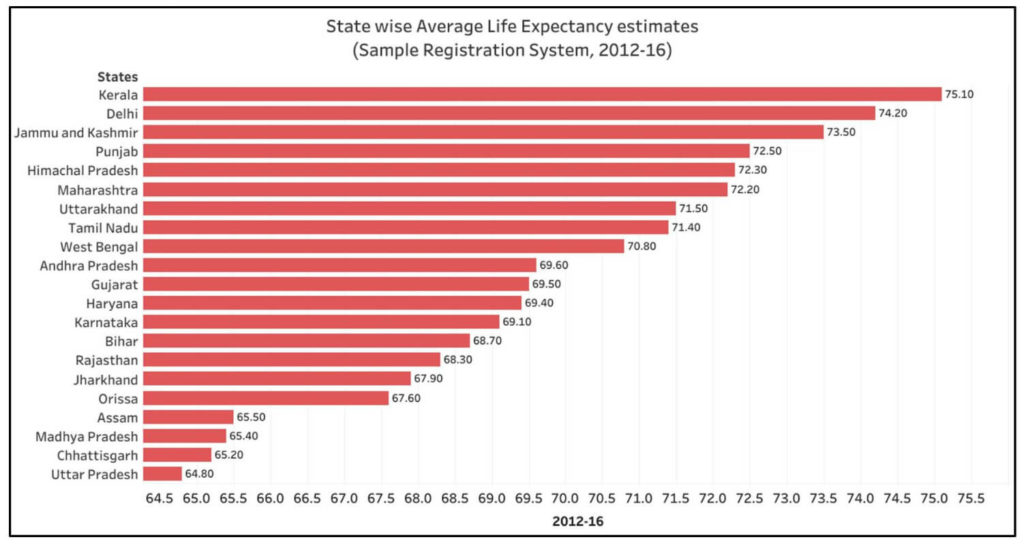
The Southern states have topped the list all through
In general, the Southern states have much better life expectancy compared to the other states. Kerala had the highest life expectancy all through. In fact, Kerala has the highest life expectancy of the total population as well as for females at 77.9 years, for the period 2012-16. Delhi leads with the life expectancy for males at 72.7 years during this period. For the period 2012-16, Uttar Pradesh has the lowest life expectancy for females whereas Chhattisgarh is at bottom of the list in the case of males.
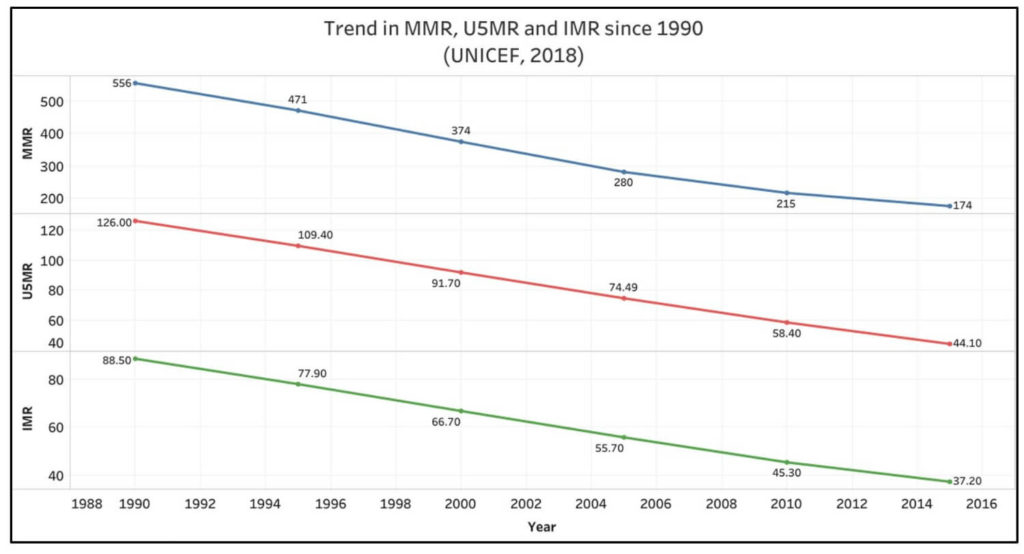
IMR, MMR and Under five Mortality Rates improve, but a long way to go to reach SDG targets
The WHO defines Infant Mortality Rate (IMR) as the probability of the infant dying between birth and one year of age as against 1000 live births. Maternal Mortality Rate (MMR) is measured as the number of maternal deaths that occur for every 100,000 live births. The Under-five Mortality Rate (U5MR) is used to express the probability of dying between birth and attaining five years of age as measured against 1000 live births.
The trend of the above mentioned rates in India from 1990 till the latest available data up to 2015 is in the following graph. All these three rates (IMR, MMR & U5MR) have improved substantially in the last 25 odd years. All these rates influence average life expectancy. As can be seen from the data, improvement in these rates has resulted in an increase in the life expectancy. Further, census reports of the earlier years suggest that the literacy level has also increased simultaneously from 1991 to 2011 by 41.8%.
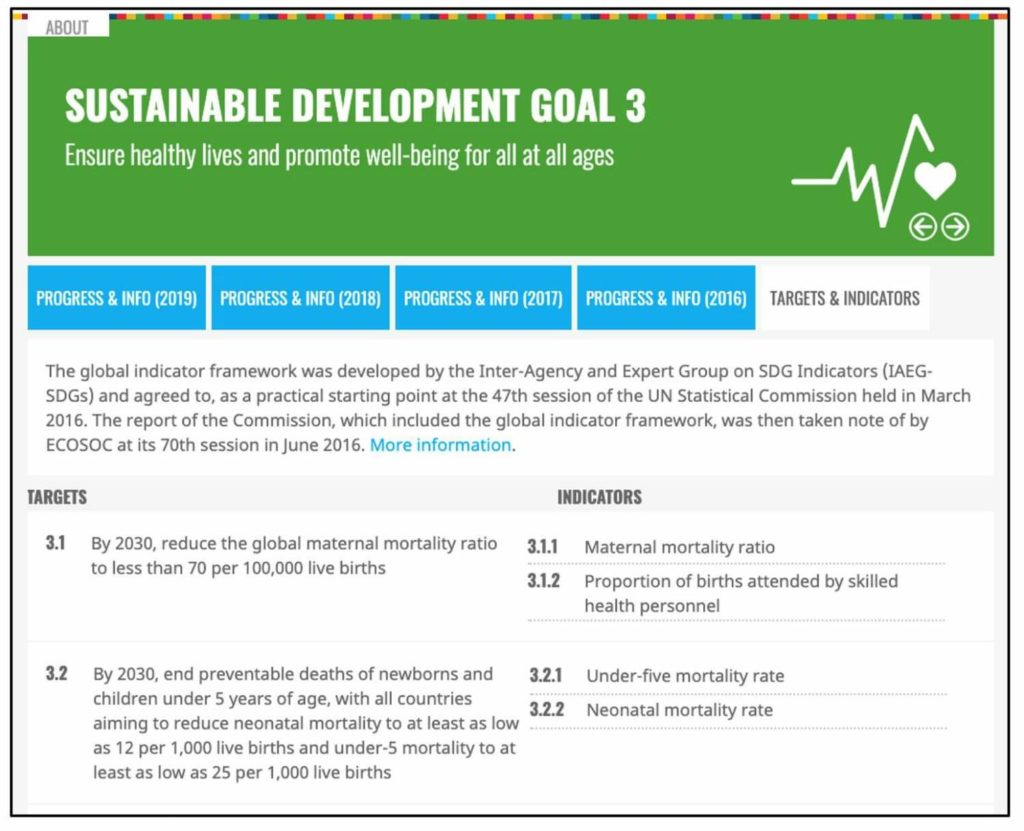
Still a long way to go to reach SDG targets
The Sustainable Development Goal 3 aimed at ensuring good health and well-being of people of all ages has targets to be achieved by 2030, one of which is to reduce the global MMR to less than 70 deaths per 100,000 live births. Another target aims at ending all preventable deaths of new born infants and bringing down the Neonatal Mortality Rate to 12 per 1000 live births by 2030, while the Under-five Mortality Rate also needs to brought down to at least 25 per 1000 live births.
As is evident from the historical data, while India has made progress over the last few decades, a lot more needs to be done in the next 10 years, at a greater pace, if we are to reach the SDG targets.
Featured Image: India’s Average Life Expectancy at birth

