FACTLY was founded with a vision of making public information & data meaningful to the common man. Towards this end, we have launched the beta version of our first data tool ‘Counting India’ today.
![]()
Counting India (CI) is Factly’s attempt to bridge the gap between the facts and the narrative. It is our attempt to process the data available and present it in a way you will understand. It is a journey that can take you as far as you want, from Kashmir to Kanyakumari with a special set of eyes. Eyes that will crunch the numbers, create personalized data visualization on key demographics and eyes that cannot lie.
Counting India makes data related to the States/Districts in India more accessible and understandable. The primary source of data for CI is the Census of India 2011 and other official sources. In CI, one can compare any two States/Districts side by side. One can also embed, access or download the data.
We envision that every person who is interested in using data in their sphere of work will value CI’s platform. CI will also be a reliable resource for policy makers, journalists and researchers to explore and discover stories of public interest in India.
CI code is licensed under the MIT License. CI has been modeled on tools like Wazimap Kenya, Census Reporter and as inspired by NepalMap.
Features of Counting India
- CI currently has data of States & Districts (as per the 2011 census) on Demographics, Religion, Education, Marital Status, Age group & Workers. We will continue to add more datasets in the future.
- Census data is massive, and sometimes it’s hard to find the table you’re looking for. Search by table and column keywords.
- We want to help you tell great stories. Maps and distribution charts help uncover what’s interesting, so you can take it from there.
How to use Counting India?
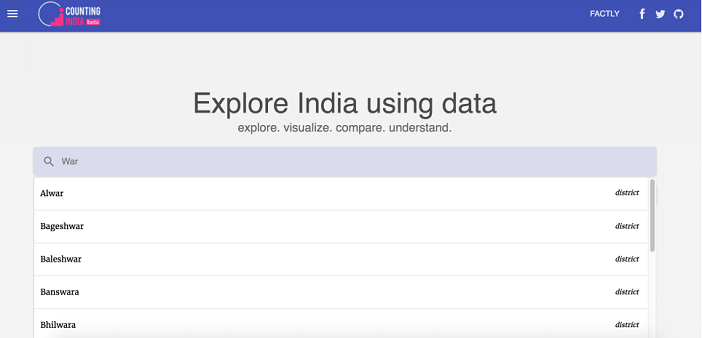
Search for any State/District by typing in the first few characters in the in the name of any State/District. Then select the location you are interested in from the drop-down.
Alternatively, click on the map area you want to go to. The + and – buttons zoom in an out.
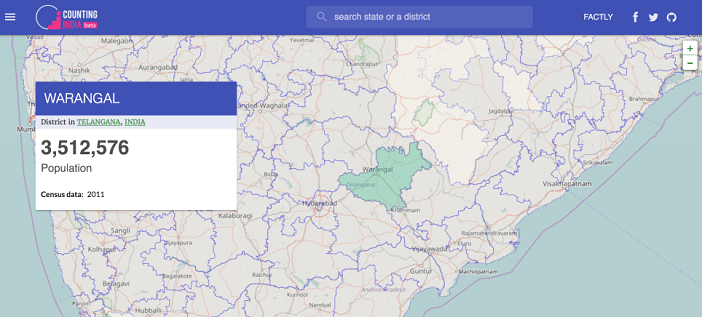
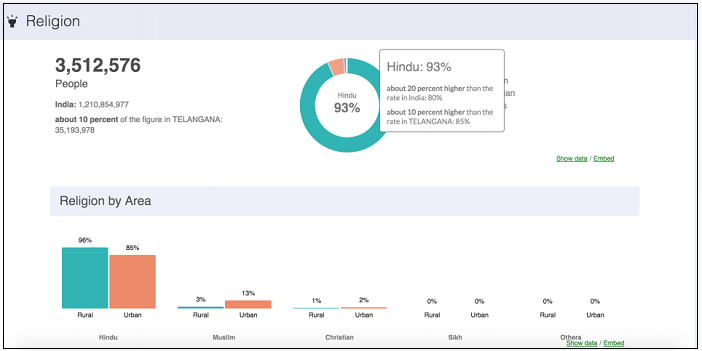
Once you select the location, data about that location appear. Statistics are broken down into categories. Find a key figure for a sub-category on the left.
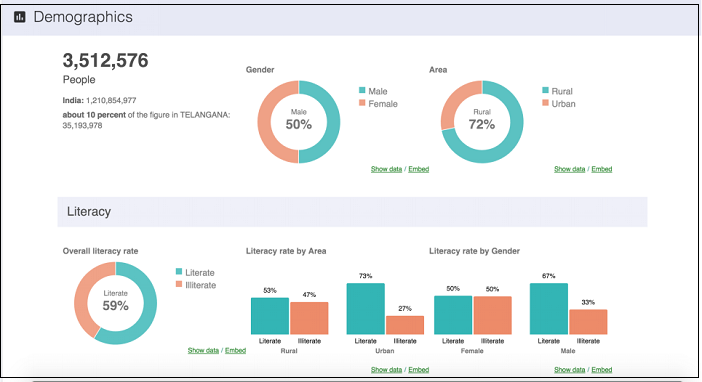
Hover over graphs to see comparisons with the district and country averages.
Please send us your feedback to ci@factly.in


4 Comments
I truly appreciate your efforts in making “public information” public. And, i like your idea of having a visualization tool to paint the data in the name of CountingIndia. I reviewed the website and I understand that it is still in Beta version. However, I think there is one information which I feel, shouldnt be there – details of Religion. In our conscious war about “unity in diversity”, topics like religion, caste etc are best avoided as much as possible.
No, I dont want to hear a news saying “Mr.ABC belonging to XYZ caste achieved/died/outperformed…”
Avoiding talking about these social attributes may not achieve unity in moral sense, but it definitely will not promote divisiveness.
Some people out there can have a quite contrasting perception which I understand, but not agree to.
Thanks again, for your wonderful efforts to engage, educate and enrich people.
With the launch of the Galaxy S7 and the S7 edge, people have already started to look forward to the next flagship launch from Samsung, the Galaxy S8. But if rumors are to be believed, work has already started for the next installment of the Galaxy S series, the Galaxy S9.
Get Thai lotto tips, King of Thailand lottery sure number
The headphone jack is said to have been removed from both Google Pixel 2 phones.