[orc]The trend of NOTA vote share being higher in reserved constituencies continued even in 2019. In the 2019 Lok Sabha polls, NOTA in ST reserved constituencies polled 1.81% compared to 0.97% in general constituencies.
As noted in an earlier story by Factly, the vote share for NOTA in reserved constituencies was higher than its vote share in general constituencies. As per ECI’s result data for the 2019 Lok Sabha & Assembly elections, this trend has continued.
For the purpose of this analysis, we looked at the data from 43 different elections & 6298 constituencies (both Lok Sabha & Assembly) that went to polls after the introduction of NOTA in the year 2013. Out of these, 4454 are General (GEN) constituencies, 935 are SC reserved (SC) and the remaining 909 are ST reserved (ST). It has to be noted that certain states like Andhra Pradesh, Odisha, Telangana, Madhya Pradesh, Rajasthan, Chhattisgarh, Mizoram & Delhi had two assembly elections after the introduction of NOTA.
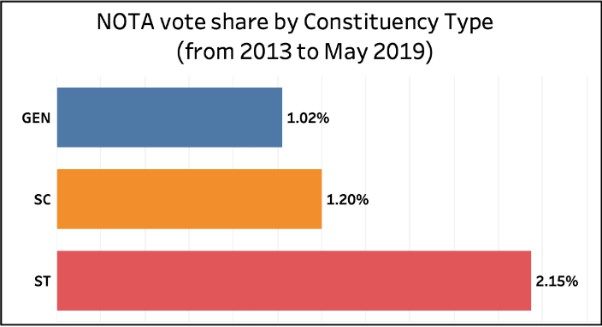
NOTA share in ST seats more than double the share in General seatsIf all the elections conducted so far after the introduction of NOTA are considered, the NOTA vote share was lowest in the GEN seats (1.02%) followed by SC reserved seats (1.20%). The ST reserved seats had the highest NOTA vote share with 2.15%, which is more than double the vote share in general seats.
The trend continues year after year
The trend of reserved constituencies polling a greater vote share for NOTA is not limited to any specific year. Year after year, the trend continued. In the year 2013 when NOTA was first introduced, NOTA vote share in GEN seats was 1.54% compared to 1.94% in SC reserved and 3.42% in ST reserved seats. This continued even in the assembly elections in 2014 and then in the Lok Sabha election of 2014. In the 2014 Lok Sabha elections, NOTA polled 0.95% in GEN seats compared to 1.1% in SC reserved and 2.18% in ST reserved seats. In the recently concluded 2019 Lok Sabha elections, NOTA polled 0.97% in GEN seats compared to 1.12% in SC reserved and 1.81% in ST reserved seats.
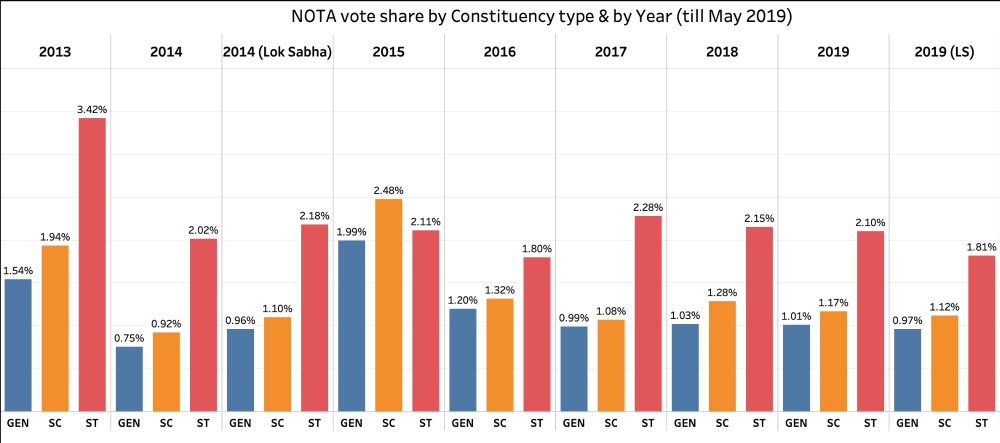
This trend was broken only once in 2015 when Bihar went to polls. In 2015, NOTA polled 1.99% in GEN seats while polling 2.11% in ST reserved and 2.48% in SC reserved. This is the only year when NOTA vote share was highest in SC reserved seats. In all other years, the NOTA share was highest in the ST reserved seats. The trend continued in 2016, 2017, 2018 & even in the recently concluded assembly elections in 2019. In each of the years 2017, 2018 & 2019, the NOTA vote share in ST reserved seats is more than double the vote share of NOTA in GEN seats.
Puducherry is the only exception
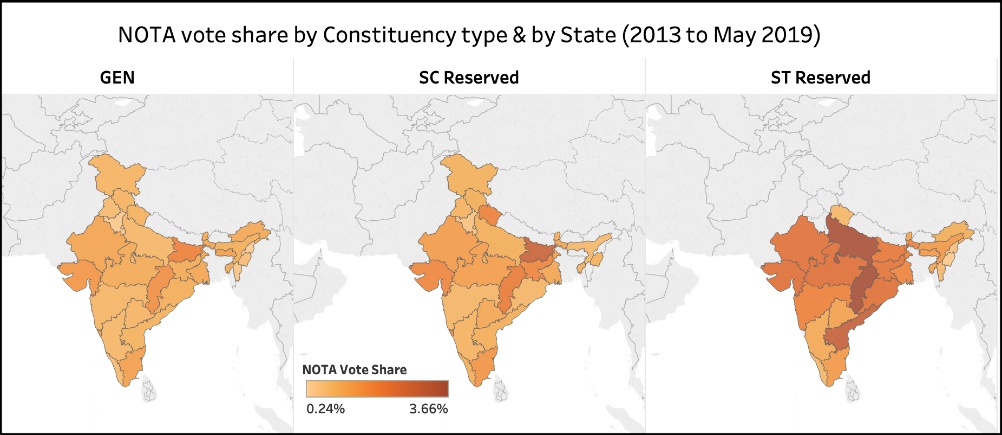
This trend of NOTA vote share being more in reserved constituencies was observed every state except in the small UT of Puducherry. Though this trend was also not observed in Arunachal Pradesh, it is for a strange reason. In Arunachal Pradesh, all the 60 assembly constituencies & the 2 Lok Sabha constituencies are ST reserved. Only for the 2014 assembly elections, one of the assembly constituencies was made general, and the NOTA share in that constituency is slightly more than combined NOTA share in all the other constituencies of the state. In Puducherry, there are 5 SC reserved assembly constituencies out of the 30 and the remaining 25 are general. The NOTA vote share in hose 25 general constituencies is greater than its vote share in the reserved constituencies.
In every other state, NOTA vote share was more in reserved constituencies compared to the general constituencies. The NOTA vote share in ST reserved seats in some states was more than twice or even three times the vote share in general seats in some cases.
| NOTA Vote Share (from 2013 to May 2019) | |||
| State | GEN | SC | ST |
| Andhra Pradesh | 0.92% | 1.01% | 3.00% |
| Arunachal Pradesh | 1.16% | NA | 1.05% |
| Assam | 0.99% | 0.74% | 1.41% |
| Bihar | 1.88% | 2.90% | 2.11% |
| Chhattisgarh | 1.60% | 2.05% | 3.66% |
| Goa | 1.29% | 1.69% | NA |
| Gujarat | 1.48% | 1.77% | 2.38% |
| Haryana | 0.33% | 0.47% | NA |
| Himachal Pradesh | 0.87% | 0.98% | NA |
| Jammu & Kashmir | 0.86% | 0.93% | NA |
| Jharkhand | 1.05% | 1.80% | 2.22% |
| Karnataka | 0.77% | 0.87% | 1.10% |
| Kerala | 0.69% | 0.98% | 0.73% |
| Madhya Pradesh | 1.06% | 1.31% | 2.39% |
| Maharashtra | 0.81% | 0.80% | 1.92% |
| Manipur | 0.61% | 0.91% | 0.31% |
| Meghalaya | 1.28% | NA | 1.38% |
| Mizoram | 0.41% | NA | 0.74% |
| Nagaland | 0.24% | NA | 0.55% |
| Delhi | 0.47% | 0.64% | NA |
| Odisha | 1.01% | 0.80% | 2.34% |
| Puducherry | 2.08% | 1.46% | NA |
| Punjab | 0.69% | 0.86% | NA |
| Rajasthan | 1.19% | 1.34% | 2.33% |
| Sikkim | 1.05% | 1.02% | 1.14% |
| Tamil Nadu | 1.30% | 1.50% | 1.41% |
| Telangana | 0.84% | 1.12% | 1.25% |
| Tripura | 1.04% | 0.92% | 1.16% |
| Uttar Pradesh | 0.77% | 0.98% | 3.57% |
| Uttarakhand | 0.88% | 1.91% | 0.77% |
| West Bengal | 1.16% | 1.14% | 1.80% |
| All India | 1.02% | 1.20% | 2.15% |
What could be the reasons for this?
Multiple media houses have highlighted this in the past like The Hindu, The Indian Express, Mint, The EPW etc. Almost all of these stories pointed towards some kind of mobilization around caste, especially in reserved constituencies. In some tribal pockets, the non-tribals do not want to vote for the tribal candidates. In some other places, caste based groups have given an open call asking their community to vote for NOTA as a symbol of protest against caste based reservation. In some other places affected by left wing extremism, the NOTA vote share is unusually high. While all these are anecdotal evidence, they point to a trend of mobilization for NOTA in reserved constituencies. It will need a much more detailed analysis to get a sense of the underlying reasons for this phenomenon. But the continuing trend even in 2019 is alarming.


3 Comments
Pingback: 2019 LS polls: Most NOTA votes in SC & ST reserved seats, Naxal-hit areas – ASIA TV
Pingback: 2019 LS polls: Most NOTA votes in SC & ST reserved seats, Naxal-hit areas - Business Standard
Pingback: 2019 LS polls: Most NOTA votes in SC & ST reserved seats, Naxal-hit areas – Polling Booth – News – Polling Booth