[orc]In state after state & year after year, NOTA has polled a greater percentage of votes in reserved constituencies (SC/ST) compared to general constituencies. It points to an alarming trend.
In an earlier story, Factly had written about how NOTA is losing sheen over the years. Further analysis of the data also reveals a trend where NOTA has polled a greater percentage of votes in reserved constituencies (SC/ST) compared to general constituencies.
For the purpose of this analysis, we looked at the data from 38 different elections & 5342 constituencies (both Lok Sabha & Assembly) that went to polls after the introduction of NOTA in the year 2013. Out of these, 3795 are General (GEN) constituencies, 796 are SC reserved (SC) and the remaining 751 are ST reserved (ST). It has to be noted that certain states like Telangana, Madhya Pradesh, Rajasthan, Chhattisgarh, Mizoram & Delhi had two assembly elections after the introduction of NOTA.
NOTA share in ST seats more than double the share in General seats
If all the elections conducted so far are considered (after the introduction of NOTA), the NOTA vote share was lowest in the GEN seats (1.05%) followed by SC reserved seats (1.24%). The ST reserved seats had the highest NOTA vote share with 2.31%, which is more than double the vote share in general seats.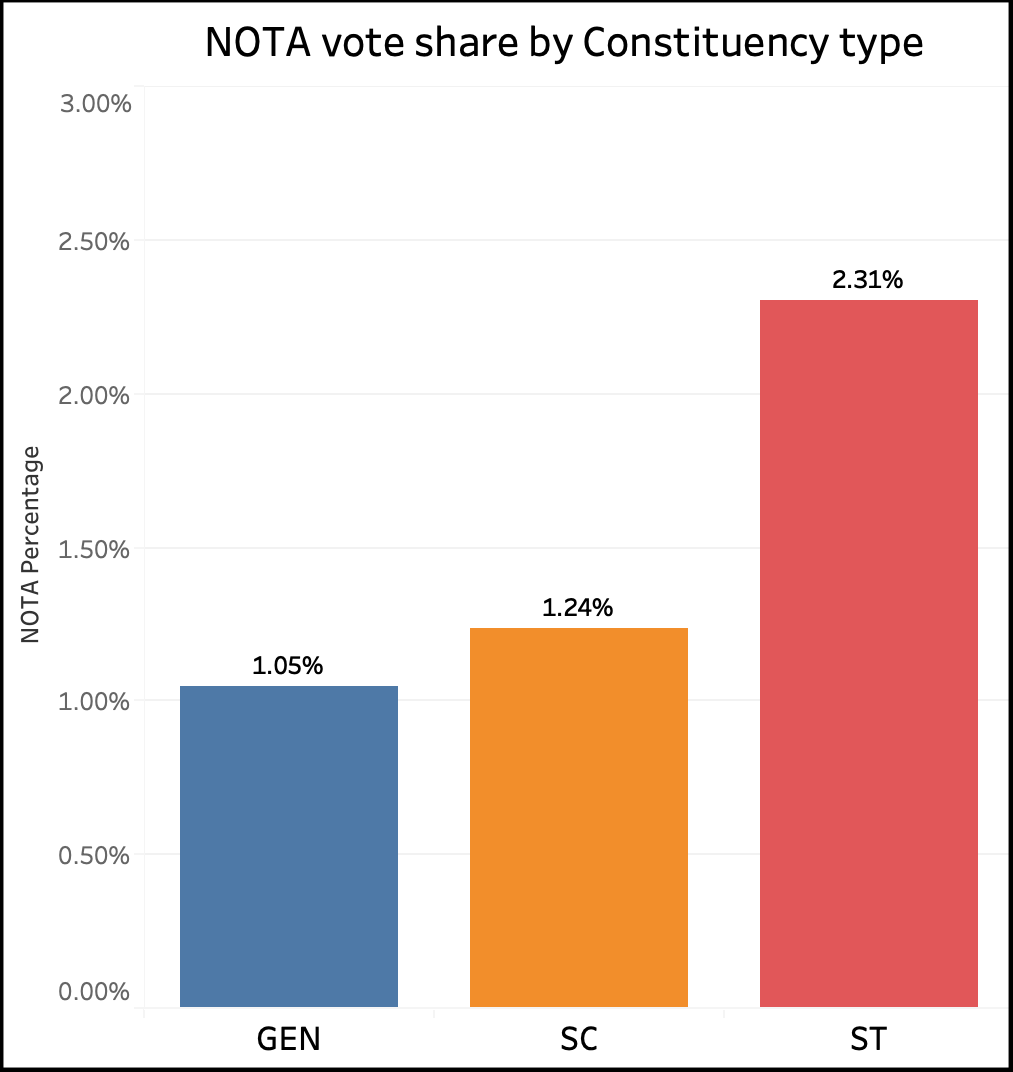
The trend continues year after year
The trend of reserved constituencies polling a greater vote share for NOTA is not limited to any specific year. Year after year, the trend continued. In the year 2013 when NOTA was first introduced, NOTA vote share in GEN seats was 1.54% compared to 1.94% in SC reserved and 3.42% in ST reserved seats. This continued even in the assembly elections in 2014 and even in the Lok Sabha election of 2014. In the 2014 Lok Sabha elections, NOTA polled 0.95% in GEN seats compared to 1.1% in SC reserved and 2.18% in ST reserved seats.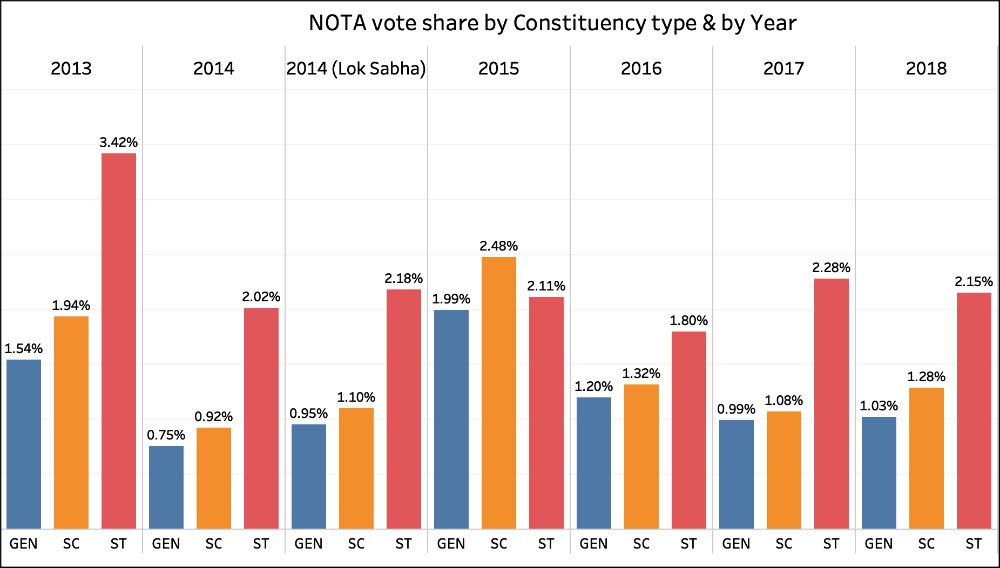 This trend was broken only once in 2015 when Bihar went to polls. In 2015, NOTA polled 1.99% in GEN seats while polling 2.11% in ST reserved and 2.48% in SC reserved. This is the only year when NOTA vote share was highest in SC reserved seats. In all other years, the NOTA share was highest in the ST reserved seats. The trend continued in 2016, 2017 & even in the recently concluded assembly elections in 2018. In both 2017 & 2018, the NOTA vote share in ST reserved seats is more than double the vote share of NOTA in GEN seats.
Arunachal Pradesh and Jammu & Kashmir are the only exceptions
This trend of NOTA vote share being more in reserved constituencies was observed in almost every state except in Arunachal Pradesh, Jammu & Kashmir and the small UT of Puducherry. In every other state, NOTA vote share was more in reserved constituencies compared to the general constituencies. The NOTA vote share in ST seats in some states was more than twice or even three times the vote share in general seats in some cases.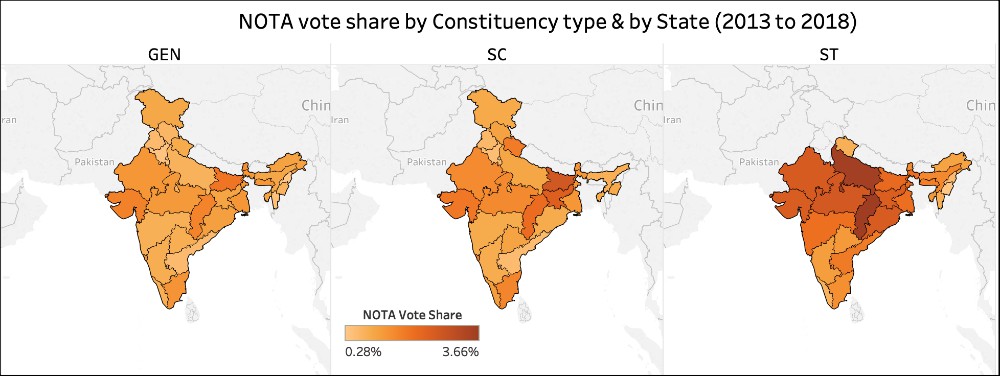
| State | NOTA Vote Share (from 2013 to 2018) | ||
|---|---|---|---|
| GEN | SC | ST | |
| Andhra Pradesh | 0.55% | 0.54% | 1.77% |
| Arunachal Pradesh | 1.06% | NA | 1.04% |
| Assam | 0.99% | 0.80% | 1.54% |
| Bihar | 1.89% | 2.65% | 2.11% |
| Chhattisgarh | 1.60% | 2.05% | 3.66% |
| Goa | 1.21% | 1.69% | NA |
| Gujarat | 1.64% | 1.83% | 2.49% |
| Haryana | 0.34% | 0.47% | NA |
| Himachal Pradesh | 0.64% | 1.06% | NA |
| Jammu & Kashmir | 0.96% | 0.93% | NA |
| Jharkhand | 1.02% | 2.41% | 2.45% |
| Karnataka | 0.84% | 0.87% | 1.14% |
| Kerala | 0.80% | 1.14% | 0.73% |
| Madhya Pradesh | 1.20% | 1.50% | 2.62% |
| Maharashtra | 0.78% | 0.90% | 1.99% |
| Manipur | 0.73% | 0.91% | 0.30% |
| Meghalaya | 1.28% | NA | 1.70% |
| Mizoram | 0.41% | NA | 0.82% |
| Nagaland | 0.28% | NA | 0.55% |
| Delhi | 0.47% | 0.61% | NA |
| Odisha | 1.10% | 0.90% | 2.53% |
| Puducherry | 2.39% | 1.46% | NA |
| Punjab | 0.56% | 0.59% | NA |
| Rajasthan | 1.28% | 1.48% | 2.56% |
| Sikkim | 1.43% | 1.32% | 1.43% |
| Tamil Nadu | 1.32% | 1.57% | 1.41% |
| Telangana | 0.82% | 1.05% | 1.22% |
| Tripura | 1.02% | 0.92% | 1.21% |
| Uttar Pradesh | 0.73% | 1.00% | 3.57% |
| Uttarakhand | 0.90% | 1.76% | 0.77% |
| West Bengal | 1.27% | 1.28% | 2.01% |
| All India | 1.05% | 1.24% | 2.31% |
What could be the reasons for this?
Multiple news stories have highlighted this in the past like The Hindu, The Indian Express, Mint, The EPW etc. Almost all of these stories pointed towards some kind of mobilization around caste, especially in reserved constituencies. In some tribal pockets, the non-tribals do not want to vote for the tribal candidates. In some other places, caste based groups have given an open call asking their community to vote for NOTA as a symbol of protest against caste based reservation. While all these are anecdotal evidence, they point to a trend of mobilization for NOTA in reserved constituencies. It will need a much more detailed analysis to get a sense of the underlying reasons for this phenomenon. But the current trend is alarming.


1 Comment
Hello, appreciate your effort. would like to know whether there is data on community wise distribution of state level ministries(of each govt formed), community wise distribution of MLAs/MPs won in every election . Disclaimer: This is not to encourage caste/community feeling but the opposite.