The Multidimensional Poverty Index (MPI): A Progress Review 2023 based on NFHS 5th round (2019-21) indicates huge variation across India’s districts. The share of population that is multidimensionally poor ranges from 0% in Ernakulam to 55% in Bahraich.
Recently, NITI Aayog released the Multidimensional Poverty Index (MPI): A Progress Review 2023 based on NFHS 5th round (2019-21), which looks at India’s progress in reducing multidimensional poverty between NFHS-4 (2015-16) and NFHS-5 (2019-21). The Index is based on three dimensions — health, education, and standard of living. These dimensions are further based on 12 segments — nutrition, child and adolescent mortality, maternal health, years of schooling, school attendance, cooking fuel, sanitation, drinking water, electricity, housing, assets, and bank accounts.
Earlier, Factly published a story in which the performance of the country and the states was discussed. It was seen that the number of multidimensional poor individuals came down from 1 in 4 individuals to nearly 1 in 7 individuals. In absolute figures, over 135 million people, or 13.5 crore individuals had exited multidimensional poverty between 2015-16 and 2019-21. Furthermore, it was observed that a total of 14 states including all the South Indian states had less than 10% population in poverty while one-third of Bihar’s population was poor. The report also revealed a huge disparity in the number of people in poverty in rural and urban areas. In rural areas, the share of individuals in multidimensional poverty dropped significantly from 32.59% in 2015-16 to 19.28% in 2019-21. The same declined in urban areas from 8.65% to 5.27%. All 12 indicators also recorded an improvement over the previous NFHS survey.
In this story, we look at the performance of districts with respect to the headcount ratio, intensity, and MPI in 2019-21. A total of 707 districts have been evaluated in the report, enabling a detailed examination of poverty trends across districts as well, in addition to states/UTs.
Share of people in multidimensional poverty ranges from 0 in Ernakulam district to 55% in Bahraich, UP
At the national level, the headcount ratio was 24.8%. The headcount ratio in the report refers to the share of the population that lies below the poverty threshold or in this case, it is the share of the population that is multidimensionally poor. There is a huge variation across districts in the share of the population that is multidimensionally poor. It varies from 0 in Ernakulam district, Kerala to 54.4% in Uttar Pradesh’s Bahraich district. More than 50% of the population was multidimensionally poor in a total of 6 districts including Bahraich in Uttar Pradesh, West Khasi Hills, and West Jaintia Hills from Meghalaya, and Araria, Purnia and Supaul of Bihar. On the other hand, it is 0.1% and lower in 5 districts – Ernakulam, Thrissur, Kannur, Kollam, and Alappuzha, all in Kerala. As compared to the headcount ratio at the national level, the share of multidimensionally poor people in 129 districts was more than 24.8%. Another 171 districts had a share of less than 5% who were multidimensionally poor. As per the comparative performance of districts, Ernakulam is the sole district to record zero poverty. This came down to zero from the earlier rate of 0.10 in 2015-16.
Huge variation in multidimensional poverty is visible even within states
The disparity is not limited to districts across states but is also visible within states. For instance, in Haryana, the headcount ratio varies from 1.42% in Panchkula district to almost 40% in Nuh (Mewat). However, the state-level headcount ratio stood at 7.07%. Only 7 out of 22 districts in the state reported more poverty than the state value revealing a skewed distribution. In Assam, Mizoram, Uttar Pradesh, and Uttarakhand, poverty is concentrated in about 30% of the districts. Yet Assam and Uttar Pradesh have a higher headcount ratio than Chhattisgarh, Nagaland, and Sikkim where more than 60% of the districts had a higher share of persons living in multidimensional poverty compared state average.
The intensity of poverty means how poor are the poor. While at the national level, the intensity of poverty was 47.1%, 48 districts reported a higher intensity. The intensity was nearly 54% in West Jaintia Hills of Meghalaya, and above 50% in 13 districts. Meanwhile, it was less than 35% in Nagpur (Maharashtra), South Goa, Puducherry, Malappuram, and Alappuzha (Kerala). In 2 of the 22 districts in Haryana, the intensity was more than 45% while the state average was 43.3%. Most of the remaining districts reported 39 to 42% intensity of poverty. Similarly, in about one-third of the districts in Chhattisgarh, Jharkhand, Bihar, Himachal Pradesh, and Maharashtra, the intensity was more than the state average.
MPI was zero in five districts
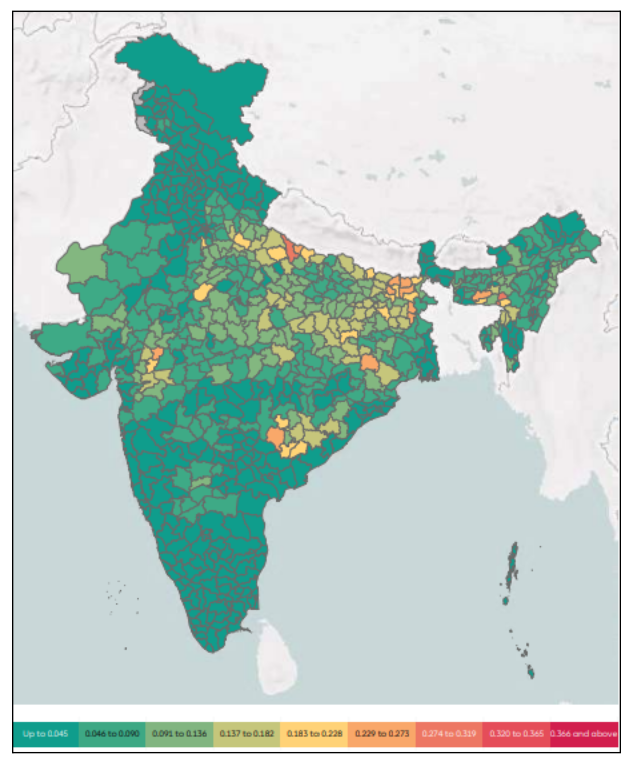
The Multidimensional Poverty Index is calculated as the product of the two indicators – Headcount ratio and intensity. The higher the value of MPI, the poorer the performance and hence greater poverty. Across districts, the value of MPI ranged from zero in 5 out of 14 districts of Kerala to more than 0.28 in Bahraich and West Jaintia Hills. While the national level MPI was 0.117, a total of 112 districts reported higher MPI than the national value. Most of these districts were in poorer performing states like Bihar, Chhattisgarh, Odisha, Madhya Pradesh, Uttar Pradesh, and Jharkhand. The performance of the districts is shown in the image below.
All aspirational districts saw a reduction in poverty except Bijapur
Comparison with the previous report reveals that the MPI has increased in some districts like Kasargod, Kottayam, Kozhikode, and Palakkad despite the overall improvement in MPI and its indicators at the state level. Similarly, some of the districts in Delhi, Punjab, Chhattisgarh, Tamil Nadu, and Haryana have also witnessed an increase between the two NFHS surveys. The share of the multidimensionally poor population increased from 39.59% to 52.48% in this period in West Khasi Hills in Meghalaya. Bijapur in Chhattisgarh saw an increase of 8.5%. Across the 112 aspirational districts marked by NITI Aayog, a decline in the share of people living in multidimensional poverty was reported in almost all the districts except Bijapur in Chhattisgarh.
District-wise data reveals that there is wide disparity across districts with respect to the population living in multidimensional poverty and the intensity of poverty. With the availability of the data at the district level, it is easier to prioritize and plan through focused efforts on specific indicators and dimensions.

