In response to a question in the Lok Sabha, the government recently shared data related to the generation of various types of waste in the last few years. Generation of all types of waste increased over the years in varying degrees. Gujarat accounted for about 28% of the hazardous waste generated in the country in 2019-20.
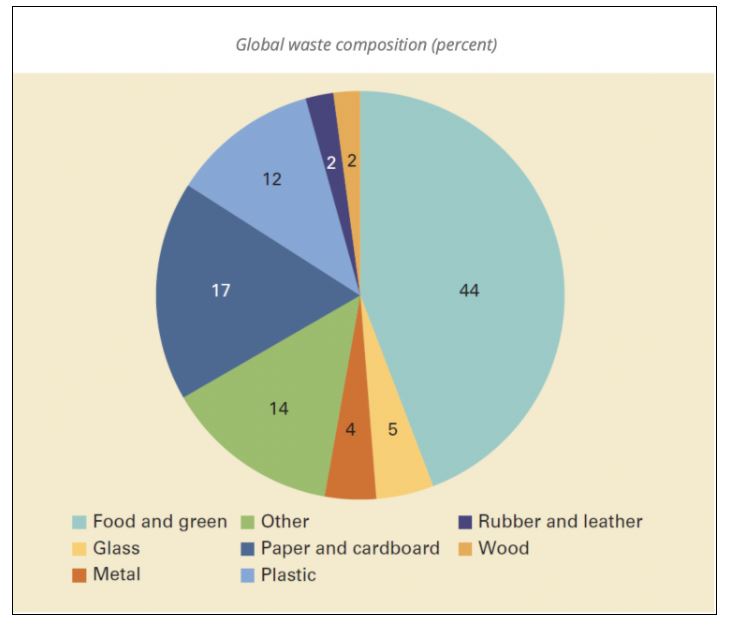
As per World Bank data, 2.01 billion tonnes of solid waste is generated annually around the world. As per conservative estimates, at least 33% of this waste is not managed in an environmentally safe manner. High-income countries account for 34% of the global waste while accounting for only 16% of the population. However, they are far ahead in waste collection rates with 96%, while in the case of Low-middle income and Low-income countries it is 51% and 39% respectively. Apart from waste collection, waste disposal is also an important issue. Around 37% of the global waste is disposed of in some form of landfill and 19% is recovered for recycling or composting. It is estimated that global waste will grow to 3.4 billion tonnes by 2050.
Increased human activity across various walks of life contributes to the generation of waste. With a population of 1.39 billion and among the faster-growing economies in the world, how does India fare with respect to Waste generation & management? In this story, we look at the data relating to Waste generation & management in India for the last few years.
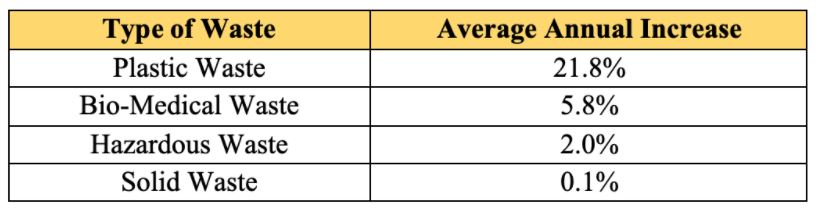
The average annual increase of Plastic Waste is 21.8%
Responding to a question in Lok Sabha, the government recently (on 06 December 2021) furnished data relating to Waste generated, collected, and processed in the country. The information is based on the annual data compiled by Central Pollution Control Board (CPCB). The data consists of information relating to the generation of solid waste, plastic waste, e-waste, construction & demolition (C&D) waste, Bio-medical waste (BMW) & Hazardous waste.
This information is collected from the respective State pollution control boards or pollution control committees i.e., SPCBs/PCCs. As per the information by CPCB, there is an increase in the generation of all the major types of waste, the more prominent being Plastic Waste. The average annual increase observed in the generation of Plastic waste is 21.6%. Bio-Medical waste recorded an average annual increase of 5.8%. Hazardous waste has an average annual increase of 2%, with the average increase in solid waste being around 0.1%.
87.82 lakh Metric tons of Hazardous waste generated in 2019-20
Any waste with properties that make it dangerous and or capable of having a harmful effect on human health or the environment is considered as ‘Hazardous Waste’ (HW). It is generated from various sources including – Industrial waste, batteries, mining, agricultural facilities, etc.
As per the data provided by CPCB, in the year 2019-20, 87.82 lakh metric tons (LMT) of Hazardous waste was generated in the country. This was a slight increase over the previous year when it was 86.39 LMT. However, the amount of waste generated in both 2018-19 and 2019-20 is less than 2017-18 when 94.38 LMT of hazardous waste was generated.
Gujarat reports the highest volume of hazardous waste generated in the country. During 2019-20, 24.85 LMT i.e., around 28% of the total hazardous waste generated in the country is from Gujarat. Maharashtra & Tamil Nadu are next with 9.99 LMT and 9.64 LMT respectively in 2019-20. During 2019-20, 12.25 lakh MT of Hazardous waste was recycled, which is lower than that of the previous year.
After a marginal growth in 2019, Bio-medical waste increased by 4.5% in 2020
As per CPCB data, an average of 647 tons of Bio-medical waste (BMW) is generated in a day during 2020. It is an increase of 4.5% compared to 2019 when an average of 619 tons of BMW was generated in a day.
The growth in BMW during 2020 is higher than that of 2019 when the increase in average per day BMW was only by 0.65%. This followed a period of increasing growth in the previous three years, where the average daily BMW increased by 3.19%, 7.9% and 10% during 2016,2017 & 2018 respectively.
Apart from the increase in the BMW generated, there is also an increase in the BMW being treated. In 2020, the bio-medical waste treated on average in a day was 577 tons a day compared to 544 tons in the earlier year. However, there is an increasing gap in the volume of BMW generated and treated. While the reasons for only a marginal increase in BMW during 2019 could not be ascertained, the relatively higher increase in 2020 could be due to the COVID-19 pandemic in the country. Data for 2021, could further confirm the impact of COVID-19 on the generation of BMW in India.
Gujarat & Uttar Pradesh have contributed to the higher increase in 2020, despite a fall in BMW in states like Tamil Nadu. In the same response provided in Lok Sabha, it is highlighted that CPCB has developed a COVID19BWM application for tracking the COVID-19 bio-medical waste generated.
An exponential increase in the e-Waste collected and processed in the country
The ever-increasing usage of electronic gadgets is reflected in the increase of e-waste being generated. Over the years, there has also been an improvement in the way e-waste is being collected and processed. This is reflected in the data collated by CPCB.
The trends in recent years show an exponential increase in the volume of e-waste being collected and processed. In the year 2016-17, the volume of e-waste collected & processed was 22.7 thousand tons per annum. The next year in 2017-18, it more than tripled to 69.4 thousand tons. In the following three years, while the growth rate has not been as high as in 2017-18, the volume of increase has been higher. In 2018-19, it increased by 95.2 thousand tons and in 2019-20, it increased by 59.3 thousand tons per annum. The year 2020-21 has seen the greatest increase in volume terms in the e-waste collected and processed. It increased by 1.3 lakh tons in 2020-21 to reach a total of 3.54 lakh tons of e-waste collected and processed.
As in the case with other types of wastes discussed so far, Gujarat generated the greatest amount of e-waste in 2020-21. There has been a marked increase in Gujarat in 2020-21 pushing Karnataka to the second position in terms of e-waste generation. In one of our earlier stories on Global e-waste based on Global E-waste monitor 2020, we reported that India generates the third-highest volume of e-waste in the world.
Increase in Plastic Waste generated over the past two years
Earlier in the story, we had highlighted that there is a higher increase in plastic waste generated in India compared to other types of waste. As per data collated by CPCB, 15.89 lakh tons per annum of plastic waste was generated in 2015-16. This reduced to 1.33 lakhs per annum in 2016-17. The reported data on plastic waste further fell to 6.6 lakhs tons per annum in 2017-18 as 22 States/UTs did not report the data. Data was not available from states like Andhra Pradesh, Assam, Karnataka & Tamil Nadu which is reflected in the lower number in that year. The fall in 2017-18 is due to the non-reporting of data rather than an actual fall in the volume of plastic waste generated in the year. Nevertheless, the total volume of plastic waste increased to 30.59 lakh tons per annum in 2018-19 and 34.69 lakh tons in 2019-20, when almost every state-reported data.
90% collection efficiency in Solid waste in 2019-20
In 2015-16, an estimated 1.01 lakh tons of solid waste was generated per day. Out of this, around 86.5 thousand tons was collected, and 20.2 thousand tons was treated. The collection efficiency during 2015-16 was 78.3% which improved to 89.1% in 2016-17.
The data provided by CPCB for 2017-18 is incomplete as data was not reported by some of the large states, as was the case with plastic waste. Andhra Pradesh, Assam, Karnataka, Maharashtra, Punjab, Rajasthan, Uttar Pradesh are among the states that did not report data in 2017-18.
In 2018-19 for which the data is available for most of the states, an estimated 1.52 lakh tons of solid waste was generated per day out of which 1.49 lakhs was collected i.e., 91% collection efficiency. Around 55.7 tons of solid waste in a day was treated during the year. In 2019-20, while the volume of solid waste generated and collected per day fell, there is an increase in the volume of solid waste treated.
A total of 18.25 lakh tons per annum of Construction & Demolition waste was generated in 2020-21, while 19.88 thousand tons per annum is processed during the year.
Need for effective collection, treatment & recycling
Increasing human & economic activity is bound to result in the increase of many kinds of waste. While various mechanisms need to be identified & implemented to reduce the generation of waste, strategies for effective collection and processing are more important. The increase in the volume of e-waste collected and processed, increase in the collection of solid waste, etc. point to increased efficiency in identifying waste in its collection for further processing. However, unless sound & fool-proof methods of treating, recycling, and disposing of the collected waste are properly implemented, the risk to humans & the environment at large would not reduce.
Featured Image: Hazardous Waste generated in India

