With the generation of E-waste increasing every year, it is soon becoming an important environmental issue around the world. India generated the 3rd highest volume of E-waste in 2019, behind China & USA as per the Global E-waste Monitor. However, India’s per capita E-waste generation is 1/3rd the global average while it is 3-times the global average in the USA.
The festive season marks the purchase of new household items including electrical and electronic items, among many other things. This season is also the time when heavy discounts are offered on a variety of products, especially the electronic goods. In many a case, the new products replace existing electronic goods. Over the years, there has been a marked increase in the consumption of Electric & Electronic goods, especially mobile phones & computers both due to advancements in technology, improvement in the economic situation & availability of cheaper products in the market.
This trend is observed across the world, where-in an increased share of population are reliant on these gadgets along with the per-capita usage. While the advancements in technology have improved our lives, they have also created new challenges. One of them being the increase in electric & electronic waste. The effectiveness of disposal of such waste not only has a bearing on the environment but also on the economy.
Global E-waste Monitor provides insights into the extent of E-waste generated globally
As per the definition provided by United Nations University/StEP Initiative 2014, an Electrical & Electronic Equipment (EEE) is – ‘Any household or business item with circuitry or electrical components with power or battery supply’.
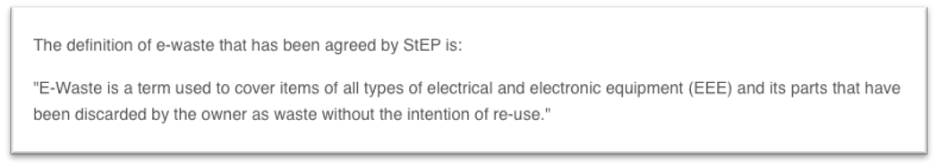
The StEP (Solving the E-waste Problem), further defines e-waste as any EEE and its parts that are discarded by the owner without the intention of re-use.
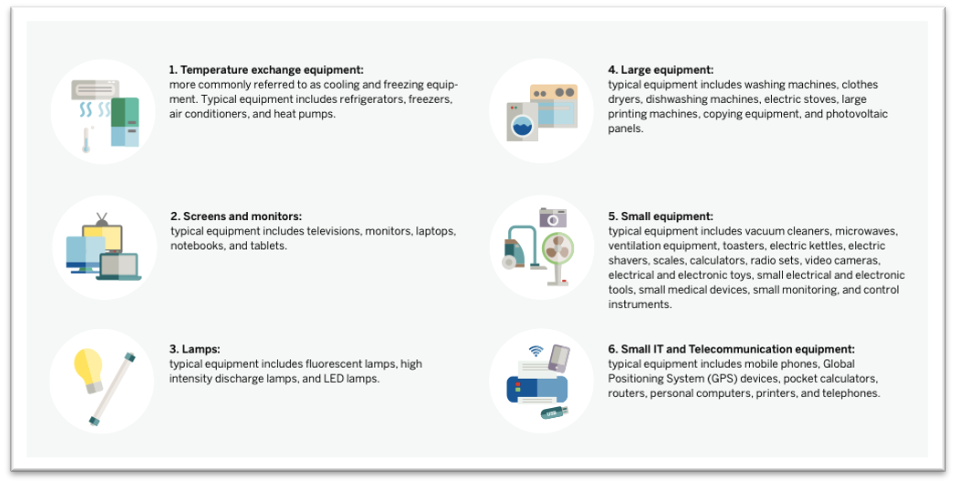
There are 6- categories of e-waste as per WEEE directive adopted by European Member states and as per the internationally recognized framework for E-waste statistics. These generally do not include any kind of batteries, accumulators or electrical components of vehicles.
All the production and consumption of EEE is potential E-waste. So, how much of E-waste is generated around the world? The Global E-Waste Monitor provides key insights into the E-waste generation and management statistics across the countries. It is a collaborative effort of the Global E-waste Statistics Partnership (GESP). GESP was formed by UN University (UNU), the International Telecommunication Union (ITU) and the International Solid Waste Association, in collaboration with the UN Environment Programme (UNEP).
The Global E-waste Monitor -2020 is the third & the latest edition, with the earlier versions being ‘Global E-waste Monitor-2014’ & ‘Global E-waste monitor -2017’.
7.3 kg per capita E-waste generated globally in 2019
As per the Global E-waste Monitor- 2020, there is an increase in the global generation of E -waste. The report highlights factors such as – a higher level of disposable incomes, urbanization, industrialization, higher consumption of EEEs, short life cycles, few repair options etc. to be contributing towards an increase in E-waste.
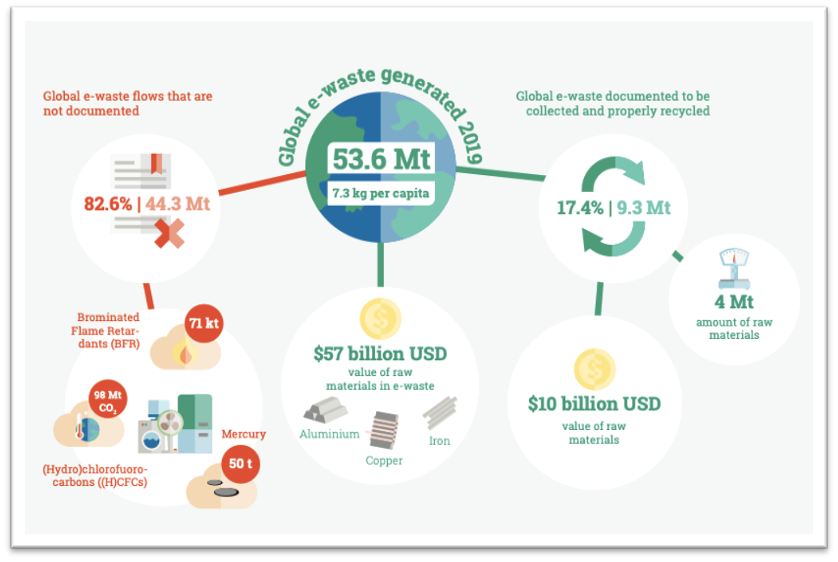
As per Global E-waste Monitor- 2020 report, a total of 53.6 Million Metric Tonnes (Mt) of e-waste was generated globally in 2019. This accounts to 7.3 kg per capita. Compared 2014, the time when the global statistics of E-waste are formally available, the global E-waste increased by 9.3 Mt. In 2014, the total E-waste was 44.4 Mt with per capita being 6.4 kg. By 2030, the global E-waste is estimated to increase to 74.7 Mt with per capita E-waste also estimated to increase to around 9 kg.
E-waste under ‘Small Equipment’ constituted the major portion of E-waste in 2019 with 17.4 Mt, followed by ‘large equipment’. The volume of e-waste under ‘Small Equipment’ grew by 4% during the five-year period (2014-19). Meantime, the E-waste under ‘large equipment’ grew by 5%. The highest increase compared to 2014, was under ‘temperature exchange equipment’, which increased by 7% to 10.8 Mt in 2019. The volume of e-waste under ‘screens & monitors’ was 6.7 Mt in 2019, a drop of 1% compared to 2014. This is the only category, where-in there has been a drop in the overall volume of E-waste in 2019, when compared with 2014.
Highest per-capita E-waste generated in Europe
Asian Region generated the highest volume of E-waste in 2019 with 24.9 Mt, followed by the Americas (North & South America) with 13.1 Mt, followed by Europe. Africa & Oceania regions have a very low volume of total E-waste generated compared to the other regions. This can be attributed to lower economic development in most of the countries in the African region and less population in Oceania.
In-spite of its position as the region with the highest E-waste, Asia ranks lower in terms of per capita E-waste compared to USA & Europe. Europe has the highest per capita E-waste generated in 2019 with 16.2 kg, followed by Oceania with 16.1 kg.
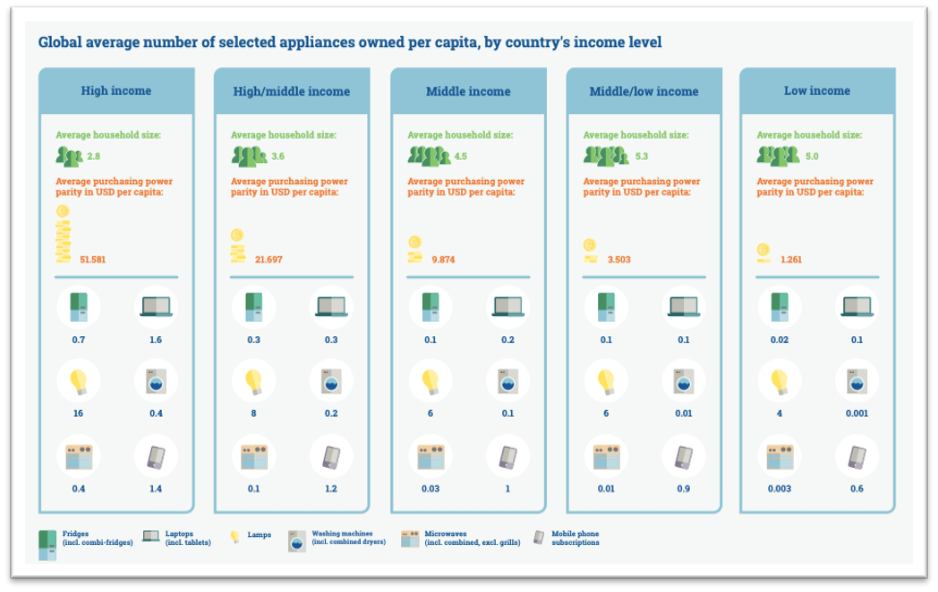
The trends in per-capita consumption validate the earlier assertions regarding the factors contributing towards E-waste, that the regions with economically developed countries report a higher per capita E-waste. This is corroborated by the other information provided in the Global E-waste Monitor report, wherein a higher number of EEE equipment are owned by Higher Income level countries compared to countries in other income levels. As discussed earlier, these EEE equipment are potential e-waste in due course of time.
Only 17.4% of the Global E-waste is documented to be collected & properly recycled
E-waste is both hazardous to nature as well as rich in precious metals. Hence proper disposal and recycling of E-waste is important – both for safe disposal of toxic materials as well as for economic benefit.
E-waste contains several toxic & hazardous substances including – mercury, Chlorofluorocarbons (CFCs), BFRs, HCFCs etc. These possess a significant risk to the environment as well as human health. It is estimated that about 50 tons of mercury and 71 Kt of BFR plastics are found globally in undocumented E-waste annually. Apart from this risk, E-waste is a mine of precious, critical & non-critical metals which can be used as secondary materials if recycled properly.
The value of raw materials in the E-waste generated globally in 2019, is estimated to be around 57 billion USD. Few of the valuable metals include- gold, copper, iron etc. However, the documented collection and recycling rate is only 17.4% i.e. 9.3 Mt in 2019. This comes up to only around 10 billion USD. Recycling these metals from the E-waste can help in the reduction of usage of virgin metals for further production.
The efficiency of documenting the E-wastage flows for collection & recycling varies across different regions. The lack of proper procedures and infrastructure results in huge proportion of undocumented E-waste in many of the lesser developed countries.
The European region has the most effective mechanism with 42.5% of the E-waste being documented to be properly collected & recycled. Asia is comparably more effective than Americas & Oceania.
Per capita E-waste generation in India is low in spite of it being the third largest generator by volume
As per the data provided in Global E-waste Monitor, India ranks third behind USA & China in terms of the total E-waste generated in 2019. China generated over 10.12 Mt of E-waste in 2019, followed by the USA with 6.91 Mt and India with 3.23 Mt. However, in terms of per capita E-waste, India is among the countries with low per capita E-waste with only 2.4 kg per capita in 2019, much lower than the global average of 7.3 kg per capita. China is also marginally less than the global average with 7.2 kg per capita. However, the USA nearly generates 3 times the global per capita E-waste with 21 kg.
While, the lower per capita E-waste is a positive sign, India does not fare well when it comes to proper collection and recycling of E-waste.
As per the available information from 2016, provided in the Global E-waste Monitor-2020, only 30 Kt (approx. 1%) is accounted for. On the other hand, China has around 10% of the E- waste documented and the USA has 15% accounted for. The data collected for Global E-waste Monitor is based on the methodology devised & standardized by GESP which includes both the sales of EEE as well as a consumption model.
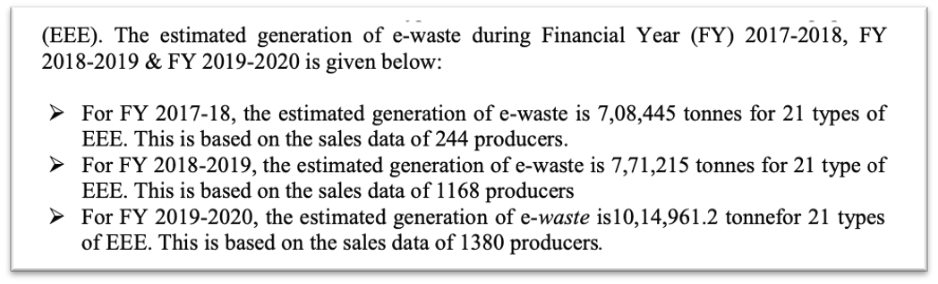
Responding to a question in Lok Sabha on 23 September 2020, the government stated that the estimate for the generation of E-waste is based on the sales data of 21 types of Notified EEE (as estimated by Central Pollution Control Board (CPCB)).
As per this estimate, the is a 32% increase in the estimated generation of E-waste in 2019-20 with 10.14 lakh tones (2019-20) compared to 7.71 lakh tones (2018-19).
Need to ramp up India’s recycling capabilities of managing e-waste
In response to the same question, the government further elucidated the policy and mechanism in place to recycle E-waste. As per CPCB’s information, there are a total of 312 authorized E-waste dismantlers or recyclers across 18 states. The overall capacity is to the tune of 7.82 lakh MTPA (Metric Tonnes per Annum).
The Government has also notified E-waste (Management) Rules, 2016 , to ensure E-waste is managed effectively. Few of the key objectives of these rules include:
- Extended responsibility to producers to manage a system of E-waste collection and channelization through Extended Producer Responsibility (EPR) Authorization.
- To promote and encourage establishment of an efficient e-waste collection mechanism
- Promote environmentally safe & sound recycling by channelizing E-waste to authorized dismantlers and recyclers of E-waste
- To minimize illegal recycling/recovery operations
- Reduce Hazardous substances in Electrical and Electronic components
In spite of near 7.82 Lakh MTPA capacity, only about 30 Kt was documented as recycled in India (in 2016). This indicates a huge gap in proper tracking of the E-waste and defining ways in which they can be sent for recycling, so that there is a closed loop from the stage of production & sale to the stage of discarding & recycling. Even though the global standard is less with only 17% of the E-waste being documented (excluding Europe could further bring the number down), India has a lot of catching up to do in terms of tracking & documenting E-waste.
Hence, in view of the potential hazards that E-waste could cause to nature, as well as the opportunity to recycle precious metals (thus reducing exploitation of nature), it is of paramount importance that the countries world over (including India) ramp up their infrastructure and streamlines the process for better tracking & recycling of e-waste.
Featured Image: Vehicle Registrations

