In the last decade or so, India has become one of the attractive destinations for Foreign Direct Investment (FDI). Data indicates that in 2022-23, the gross FDI inflows fell by 16% in 2022-23 compared to 2021-22. On the other hand, net FDI inflows fell by 27% in 2022-23.
In the last decade or so, India has become one of the attractive destinations for Foreign Direct Investment (FDI). Liberalized investment norms, elimination of regulatory barriers, low cost of labour, diversification of market and similar other factors are behind the renewed interest for FDI in India. However, the FDI inflows for the fiscal year 2022-23 have fallen for the first time in the last decade. The global economic outlook and the uncertainties vis-à-vis geopolitical tensions are some of the pull factors behind the fall in FDI inflows.
In this context, we look into some of the trends in FDI inflows to India.
What goes into FDI?
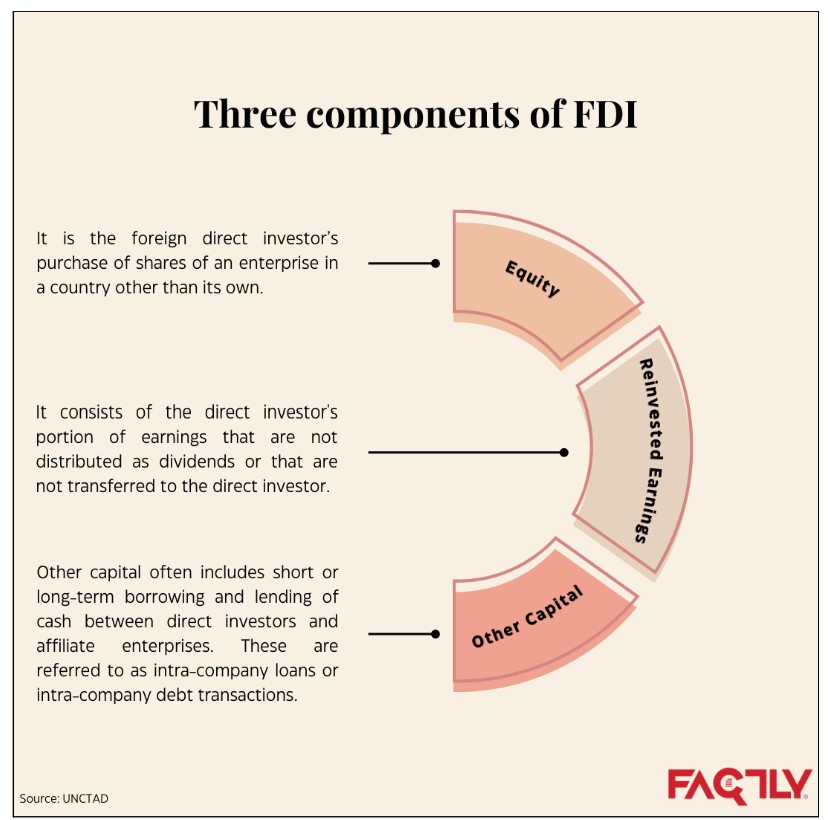
Understanding FDI and its components is crucial to analyse the potential impact of the flow of capital. FDI primarily has three components- Equity capital, Re-invested capital, and other capital generally being intra-company loans or debts.

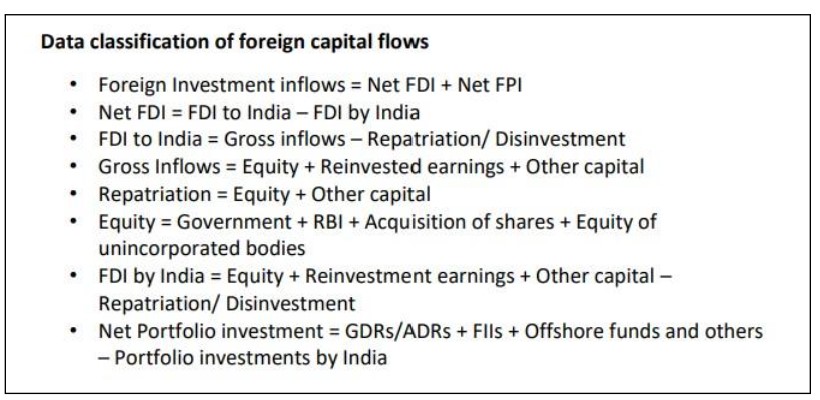
The equity component could be via government route through SIA (Secretariat of Industrial Alliance) or FIFP (Foreign Investment Facilitation Portal, which was earlier known as the Foreign Investment Promotion Board, FIPB)/ RBI’s Automatic Route/ Acquisition Route or through Equity Capital of unincorporated bodies.
FDI flows can be both inward and outward. The cumulative sum of equity, reinvested earnings and other capital gives the Gross inflows of FDI. The outflow of FDI could be either in the form of outbound FDI or disinvestment/repatriation. Disinvestment refers to the withdrawal or pulling out of direct investment.
The true level of FDI inflows is measured on a net basis. The net FDI inflows is the gross FDI inflows minus the disinvestment/repatriation. In simpler terms,
Net FDI inflows = Gross FDI – outbound FDI – Repatriation/disinvestment

Gross FDI falls for the first time, declined by 16% in 2022-23
The gross FDI declined for the first time in the last decade. A major contributor to this decline is the equity through the government/automatic/acquisition route. The re-invested earnings saw minimal positive growth while the equity and other capital also saw a major decline in 2022-23. On a yearly basis, the gross FDI fell by 16% in 2022-23 as compared to 2021-22. Prior to this, the gross FDI recorded positive growths of 3%, 10% and 20% in the last three consecutive fiscal years.
Net FDI fell by 27% in 2022-23, recording its second consecutive decline.
Despite the pandemic’s impact, gross FDI inflows increased between 2019–20 and 2021–22; however, net inflows decreased mostly due to repatriation or disinvestment by direct investors. The net FDI declined from USD 44 billion in 2020-21 to USD 38.6 billion in 2021-22, registering a decline of 12%. During 2022-23, it further declined by 27%, settling at USD 28 billion. While the decline in gross FDI is behind such a fall in net FDI, the disinvestment/repatriation proceeds have also grown during the last four fiscal years.
In 2021-22, the decline in net FDI is primarily due to FDI investments by India, whereas in 2022-23, it is mainly due to a fall in gross FDI.
Widening gap between net and gross FDI.
Gross FDI is more volatile than the net FDI and in the last ten years, the net FDI inflows has started to diverge from the gross FDI inflows. In fact, while the gross FDI has risen between 2016-2017 and 2017-2018, the net FDI has fallen in the same period. This is also the case with 2021-22.
An evaluation of relative movements of the net and gross FDI for the last decade reveal that the gap between them is widening. It grew by more than 230% from 13.89 billion USD in 2012-13 to 46.2 billion USD in 2021-22. During 2022-23, the gap fell by 7%, reaching to 42.9 billion USD.
Computer software and hardware remains the top sector attracting FDI Equity inflows.
A comparison of different sectors attracting equity FDI inflows shows that computer software and hardware is the top sector attracting the highest FDI equity inflows, followed by the services sector, and trading sector. Together, these three sectors account for almost half of the total FDI equity inflows. The share of these sectors grew from 33% in 2016-17 to a record highest of 56% during 2020-21. It fell to 49% in 2022-23.
In 2020-21, the computer software and hardware sector received its highest-ever FDI equity inflow in the last decade, most likely due to COVID-19. Its share gradually reduced during the next two fiscal years. In contrast, the share of the service sector in absolute terms fell in 2020-21, thereafter which it improved.
Mauritius, Singapore, and USA account for 60% of the total FDI Equity inflow
Mauritius remains the largest source of FDI equity inflows into India, accounting for more than a quarter of the total FDI equity inflows from April 2000 to March 2023. It is followed by Singapore with a share of 23.4%, and the United States of America with a share of 9.5% during the same period. Favourable tax regulations and lower tax rates are some of the primary reasons behind the top contributions from these nations. The amount of FDI received from the source nations is also dependent on the tax treaties between the nations.


