The COVID-19 pandemic has had a debilitating impact on the economy forcing governments to borrow more for continued spending on welfare schemes & building infrastructure. The outstanding central government debt crossed the Rs. 100 trillion mark for the first time by end of June 2020. Even the states have borrowed much more than what they did in 2019-20.
The outbreak of the Novel Coronavirus (COVID-19) pandemic emerged as a key risk to human health causing significant human costs and economic turmoil. As per IMF’s World Economic Outlook (January 2021), global growth was expected to contract sharply by 3.5 percent in 2020, much worse than during the global financial crisis of 2008-09.
India imposed different phases of lock-down starting from 25 March 2020 and continued till May 2020 when restrictions on various activities were eased in a phased manner. Economic activities came to a standstill and severely halted the growth momentum. During the lockdown period, manufacturing and services activity came to a standstill resulting in supply disruption, a drop in domestic and external demand, a reduction in trade, lower tourism and business travel, and loss of consumer and investor confidence.
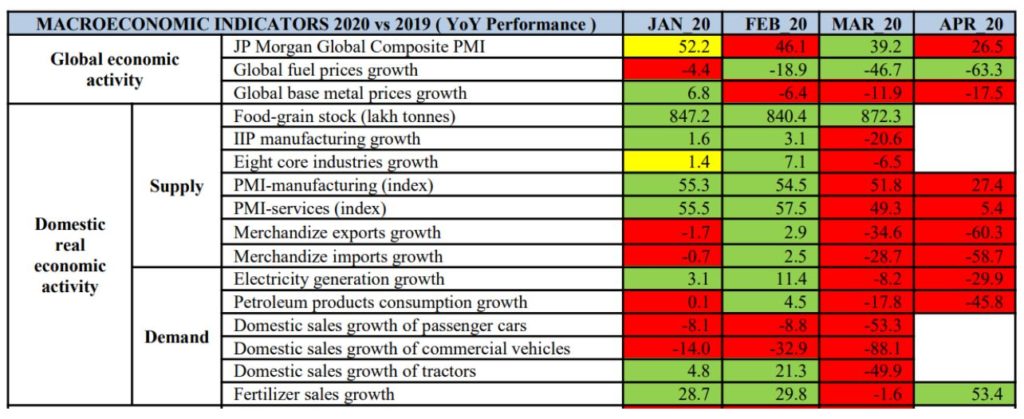
Global and domestic economic activity indicators registered a sharp decline during the period of lockdown, as highlighted in the following table provided in a Monthly Economic Report (May 2020) Finance Ministry’s Department of Economic Affairs.
Finance Ministry’s Monthly Report from May 2020 also highlights that expansionary fiscal policy was on course in 2020-21 to mitigate the adverse economic impact of COVID-19, with an increase in market borrowings by Central and State governments. As of 01 May 2020, while Centre raised 88% of its gross borrowings in the corresponding period last year, States raised more than 1.7 times, both on a gross and net basis.
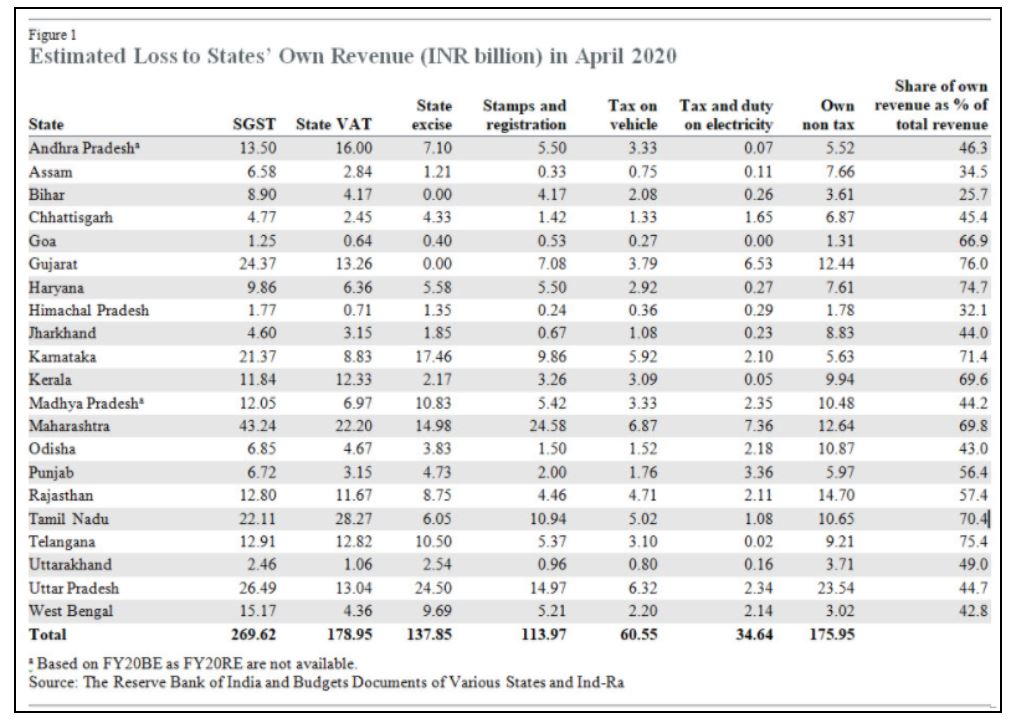
A study by India Rating of 21 major Indian States for the month of April 2020 estimates a collective revenue loss of around Rs. 971 billion. The study calculates the likely revenue loss from seven major revenue sources for states i.e., state goods and services tax (SGST), state VAT (mainly petroleum products), state excise (mainly liquor), stamps and registration fees, tax on vehicle, tax, and duty on electricity and own non-tax revenue.
The nuances of government debt (borrowings and liabilities) are explained in detail in one of our earlier articles. Previously, we have also explored the impact of the COVID-19 pandemic on market borrowings of state governments in the first half of 2020-21, State Development Loans (SDLs) in the first four months of 2020-21, and fiscal deficit targets.
Central Government Debt crossed 100-trillion mark during the pandemic.
The Debt Management Report, released quarterly by Department of Economic Affairs, gives an account of the public debt management and cash management operations of the Government of India during each quarter.
In the backdrop of the COVID-19 pandemic, for the first time, the outstanding debt of the central government crossed the Rs. 100-trillion mark at the end of June 2020. The Central Government Debt figure, including public debt, external debt, internal debt, other liabilities, are presented in the following graph. The last reported central debt figure is from the 3rd quarter of 2020 i.e., September 2020, when the outstanding debt reached Rs. 107 trillion.
State debts exceeded their Budget Estimates by higher proportions in 2020-21 as compared to 2019-20.
To understand the impact of COVID-19 on the state’s debt figures, we look at the State Accounts Reports from the Comptroller and Auditor General of India. We will look at the borrowings and other liabilities that constitute a state’s debt from 2019-20 and 2020-21.
Note: In order to compare the latest reported data, we take the State Accounts Reports from January 2021, which is available for only 21 states. Those 21 states are used for comparison the state debt figures for 2020-21 and 2019-20 to maintain consistency. Therefore, these figures do not represent all Indian states.
The State Accounts Report highlights the Budget Estimates (BE) and actuals numbers for the state’s debt under the heading ‘Borrowings & Other Liabilities (net)’, which denotes the fiscal deficit/surplus of the state in a given financial year. A glimpse of the comparison between BE and Actual Debt numbers for several states is present in the following graph.
For 2020-21, six states have registered a higher debt magnitude till January 2021 than their budget estimates for debt. In totality, the actual debt figures for these 21 states up until January 2021 are 73.64% of the respective budget estimates for 2020-21. For 2019-20, the actual debt figures for these 21 states up until January 2020 were only 63.4% of the 2019-20 estimates. In other words, these 21 states have already reached 3/4th of the debt estimates for 2020-21 by January 2021, which is 10% more than the corresponding numbers for 2019-20.
Even in terms of the absolute numbers, the actual debt figure for these 21 states for 2020-21 (up until January 2021) is almost 31% more than the actual debt figure for 2019-20 (up until January 2020).

