The 34th edition of the Fortnightly Roundup of Government Data covers reports released by NITI Aayog, the Ministry of Statistics and Programme Implementation (MoSPI), the Telecom Regulatory Authority of India (TRAI), and the Ministry of Labour & Employment.
In this 34th edition of the Fortnightly Roundup of Government Data, we look at the reports released by NITI Aayog, the Ministry of Statistics and Programme Implementation (MoSPI), the Telecom Regulatory Authority of India (TRAI), and the Ministry of Labour & Employment.
India Climate Energy Dashboard
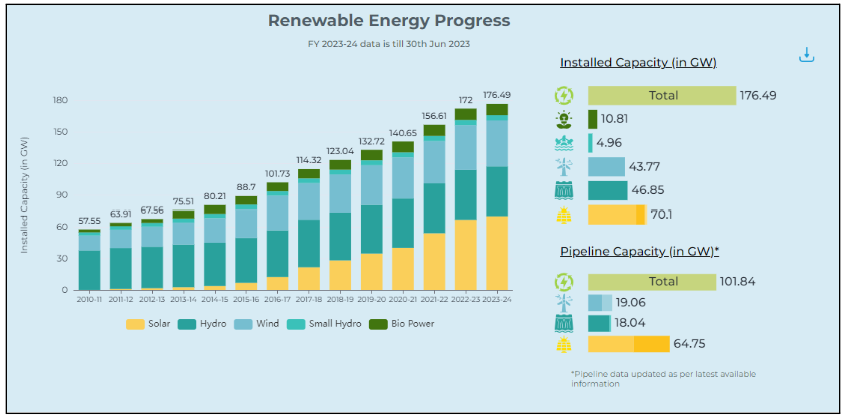
India’s policy think tank, NITI Aayog launched the India Climate Energy Dashboard (ICED) 3.0, a comprehensive platform providing near real-time data on the energy sector, climate, and related economic datasets sourced from government publications. The dashboard allows the public to access for free and analyse datasets using an analytical engine. It is interactive, user-friendly, and permits download of the infographics and datasets. The dashboard facilitates insights and enhances understanding of the energy and climate sectors while identifying the key challenges and helps in monitoring the progress of India’s clean energy transition journey.
There is data on more than 500 parameters in the dashboard, over 2000 infographics, and many other interactive visualizations, making it easy for users to gain a holistic understanding of India’s energy sector. Some datasets available include power generation, transmission, consumption, distribution, resource availability, and GHG emissions, among others.
Other reports released by NITI Aayog in the last fortnight are Multidimensional Poverty Index (MPI): A Progress Review 2023, A New Lens for Innovation in New India: Introducing the Techno-Commercial Readiness and Market Maturity Matrix, and Export Preparedness Index (EPI) 2022. We look at each of these reports in this section.
Multidimensional Poverty Index (MPI): A Progress Review 2023
| Report name | Multidimensional Poverty Index (MPI): A Progress Review 2023 |
| Sector | Sustainable Development Goals |
| Agency responsible | NITI Aayog |
| Frequency of release | – |
| Source Link | Multidimensional Poverty Index (MPI): A Progress Review 2023 |
About the report
The report looks at India’s progress in reducing multidimensional poverty between NFHS-4 (2015-16) and NFHS-5 (2019-21). The first report or the baseline report was released in 2021 based on NFHS-4 data. NITI Aayog started publishing the Index after acknowledging the Global Multidimensional Poverty Index that captures overlapping deprivations in health, education, and living standards.
The Multidimensional Poverty Index (MPI) is based on three dimensions — health, education, and standard of living — with each having a weightage of one-third in the index. These dimensions are further based on 12 segments — nutrition, child and adolescent mortality, maternal health, years of schooling, school attendance, cooking fuel, sanitation, drinking water, electricity, housing, assets, and bank accounts.
Key Findings
The report finds that India is on track to achieve this target. The number of “multidimensionally poor” individuals in India has reduced from 1 in 4 individuals to nearly 1 in 7 individuals between 2015-16 & 2019-21. In absolute figures, over 135 million people, or 13.5 crore individuals exited multidimensional poverty between 2015-16 and 2019-21.
- Bihar witnessed the fastest decline in the percentage of multidimensional poor from more than 51% to below 34% during this period. Despite the steep decline, Bihar continues to have the highest share of a multidimensionally poor population for a state with one-third of the population multidimensionally poor.
- Uttar Pradesh recorded the highest number of persons exiting multidimensional poverty in the last five years with 3.43 crore persons, followed by Bihar with 2.25 crore and Madhya Pradesh with 1.36 crore persons.
- All five South Indian states have less than 10% population identified as multidimensionally poor.
- Improvement has been recorded across all 12 indicators. Most of the indicators under Standard of Living are the ones that have significantly contributed to the decline in MPI despite further scope for improvement.
- The report lauds targeted interventions and policies for this progress.
To know more about the report in detail and what the UNDP’s Global MPI report tells about India’s poverty, read this story by Factly.
Export Preparedness Index – 2022
| Report name | Export Preparedness Index – 2022 |
| Sector | Commerce |
| Agency responsible | NITI Aayog |
| Frequency of release | Yearly |
| Source Link | Export Preparedness Index – 2022 |
Brief about the report
The report presents a comprehensive analysis of India’s export performance in FY22, along with its sector-specific and district-level merchandise export trends. The EPI 2022 Report evaluates the performance of the states across four pillars – Policy, Business Ecosystem, Export Ecosystem, and Export Performance. The index uses 56 indicators which holistically capture the export preparedness of States and UTs in terms of exports at both the state and district level. The insights of the report are expected to help in decision-making, identify strengths, address weaknesses, and foster comprehensive growth across States and UTs. This is the third edition of the publication.
Key findings
- Tamil Nadu topped in EPI 2022 with a score of 80.89. The top three exporting districts of Tamil Nadu are Kanchipuram, Chennai, and Tiruppur.
- Maharashtra (78.2) and Karnataka (76.36) are placed second and third respectively. Gujarat (73.22) which was ranked first in 2021 has been pushed to fourth position this year.
- ‘Coastal States’ have performed well, with the states of Tamil Nadu, Maharashtra, Karnataka, and Gujarat being the top performers in EPI across the country. The higher average of coastal states represents their better preparedness and higher contribution to the national exports.
- Landlocked states have had a satisfactory performance in the index with Uttar Pradesh and Haryana being the positive outliers. States like Punjab and Telangana have performed adequately; however, their regional advantages are left untapped resulting in their average performance.
- Location-specific strategies to boost exports, diversification of export markets, and improvement in data availability of exports are some of the recommendations made to improve the performance.
A New Lens for Innovation in New India: Introducing the Techno-Commercial Readiness and Market Maturity Matrix
| Report name | A New Lens for Innovation in New India: Introducing the Techno-Commercial Readiness and Market Maturity Matrix |
| Sector | Commerce |
| Agency responsible | NITI Aayog |
| Frequency of release | – |
| Source Link | A New Lens for Innovation in New India: Introducing the Techno-Commercial Readiness and Market Maturity Matrix |
Brief about the paper & tool
The paper presents an assessment tool, the Techno Commercial Readiness and Market Maturity Matrix (TCRM Matrix) framework, which would allow stakeholders to jointly assess projects at the technology readiness level (TRL), commercialization readiness level (CRL), and market readiness level (MRL) scales. Such a tool facilitates informed decision-making, enhances technology commercialization prospects, and propels India towards becoming a global leader in innovation. The framework offers in-depth insights and actionable intelligence to stakeholders at every stage of the technology development cycle. It has been validated in the paper.
It is expected to help the government in prioritizing funding, risk mitigation, setting regulations, strategic planning and enhancing public-private partnerships. Likewise, the TCRM Matrix is expected to help investors, industries & startups, and contribute to academia. For instance, the investors can evaluate the commercialization and market readiness of their portfolio companies while industry and start-ups can use the tool for reviewing progress so far and determining the next steps for a given project or multiple projects, deciding about acquisition/transfer, etc.
Oil 2023
| Report name | Oil 2023 |
| Sector | Petroleum |
| Agency responsible | International Energy Agency (IEA) in collaboration with Petroleum Planning and Analysis Cell (PPAC) |
| Frequency of release | Yearly |
| Source Link | Oil 2023 |
About the report
The report, Oil 2023, is the IEA’s medium-term outlook that provides a comprehensive overview of evolving oil supply and demand dynamics through to 2028. It also explores some of the challenges and uncertainties that lie ahead in the sector such as upstream investment, sources of new supply growth, spare capacity and shifting patterns of oil demand. Further, the report also provides insights into the impact of these changing dynamics on trade flows.
Key findings
- The growth of global oil demand is set to slow down, almost coming to a halt by 2028 due to hastened shift towards cleaner energy technologies for energy security concerns.
- Despite robust demand from the petrochemical sector and aviation, annual demand growth is expected to decline from 2.4 mb/d in 2023 to just 0.4 mb/d in 2028, putting a peak in demand in sight before the end of the decade.
- Further, the use of oil for transport is set to decline after 2026 as the expansion of electric vehicles, the growth of biofuels and improving fuel economy reduce consumption. However, some economies, notably China and India, will continue to register growth throughout the forecast.
- Around three-quarters of the increase in global demand will come from Asia, with India surpassing China as the main source of growth by 2027.
- Biofuel production expands by nearly 600 kb/d from 2022 to 2028, led by significant growth from emerging economies. Brazil, Indonesia, and India combined account for 70% of the increase since biofuels are more sustainable and cleaner alternatives to fossil fuels.
Some Monthly & Quarterly updates
The details of the following monthly and quarterly publications were discussed earlier. Some key developments in these publications released this month have been mentioned below.
All-India Consumer Price Index Number for Agricultural Labourers and Rural Labourers
The All-India Consumer Price Index Number for Agricultural Labourers and Rural Labourers (Base: 1986-87=100) for June 2023 increased by 10 points each to stand at 1196 and 1207 points respectively. The major contribution towards the rise in the index of Agricultural Labourers and Rural Labourers came from the food group to the extent of 9.59 & 8.96 points respectively mainly due to increases in prices of rice, pulses, milk, meat goat, fish-fresh/dry, gur, chillies-green/dry, garlic, ginger, onion, vegetables & fruits, etc.
Payroll Reporting in India: An Employment Perspective – May 2023
MoSPI’s monthly report covers the period from September 2017 up to May 2023. It provides information on the number of subscribers under three major schemes- the Employees’ Provident Fund (EPF) Scheme, the Employees’ State Insurance (ESI) Scheme and the National Pension Scheme (NPS). As per the report, a total of 8.91 lakh new EPF subscribers were reported in April 2023 and 8.83 lakh new subscribers in May 2023. Most of them were in the 18 to 21 years age group. Under the ESI Scheme, 13.6 lakhs and 15.14 lakh newly registered employees paid contributions in April and May 2023 respectively. Over 1.25 lakh new subscribers contributed to the NPS scheme in the two months.
Report on Drive Tests in 20 Cities
Every quarter, TRAI conducts drive tests in different cities to assess the network quality provided by cellular mobile telephone service providers for voice and data services. In the last fortnight, the reports of drive tests at twenty locations -Balasore, Erode, Vizianagaram, Gangtok, Aizawl, Dimapur, Shillong, Itanagar, Jabalpur, Prayagraj, Wayanad, Gandhidham & Kandla port, Bikaner, Amritsar, Mysuru, Mysuru-Bengaluru HW, Jabalpur-Chakghat HW, Prayagraj-Banda HW, Bikaner-Nagaur HW and Amritsar-Pathankot HW, was released for the quarter ending March 2023. As per the reports, All Telecom Service Providers (TSPs) met the Drop Call Rate (DCR) benchmark of 2% and the Call Setup Success Rate (CSSR) of 95% in most of these locations like Amritsar, Vizianagaram, Bikaner, Wayanad & Erode. All 2G/3G/4G TSPs except JIO 4G, BSNL 2G & 3G have met the Rx Quality in Bengaluru-Mysuru NH. Airtel and Jio didn’t meet the Rx Quality in Prayagraj- Banda Highway and Jabalpur– Chakghat Highway.

