The 24th edition of the fortnightly government roundup covers reports released by NSSO, MoSPI, TRAI, Ministry of Finance among others.
The National Sample Survey Office (NSSO) carried out the Multiple Indicator Survey (MIS) covering the entire country in its 78th round. The primary objective of the MIS was to collect data for the generation of some important national indicators of Sustainable Development Goals (SDGs). The report was released by the Ministry of Statistics and Programme Implementation (MoSPI) in the last fortnight. In this 24th roundup of the Fortnightly Government Data Roundup, along with the NSS report, we also look at the key findings of reports released by MoSPI, TRAI, and the Finance Ministry in the last fortnight.
Report on Multiple Indicator Survey, 2020-21
| Report name | Report on Multiple Indicator Survey, 2020-21 (NSS Report No. 589) |
| Sector | Sustainable Development Goals |
| Agency responsible | National Sample Survey Office (NSSO) |
| Frequency of release | – |
| Source Link | Report on Multiple Indicator Survey, 2020-21 |
About the report
Every year, the National Sample Survey Office carries out surveys across the country and publishes reports on various sectors such as health, housing, agriculture, consumer expenditure, education, and drinking water, among others. The latest survey was on multiple indicators to estimate India’s progress with respect to Sustainable Development Goals. The survey was initially planned to be conducted during the period January and December 2020, but the fieldwork was extended further till August 2021 because of the COVID-19 pandemic. There are broadly 10 sections in the report, viz.
- Section 1: Households and Population
- Section 2: Drinking Water, Sanitation and Hand Washing
- Section 3: Energy Used by Households
- Section 4: Education and ICT skills
- Section 5: Mobile, Broadband and Mass Media
- Section 6: Financial Inclusion and Indebtedness
- Section 7: Birth Registration
- Section 8: Other Facilities
- Section 9: Purchase/Construction of new house/flat for residential purpose
- Section 10: Migration
Methodology
The whole of the Indian Union was surveyed except for some villages of Andaman and Nicobar Islands which were difficult to access. In this survey, two-stage stratified sampling was used, where First Stage Units (FSU) were villages/sub-units (SUs) in rural areas, and Urban Frame Survey (UFS) were blocks/SUs in urban areas. The FSUs were allocated to States and UTs in proportion to the population as per Census 2011. The Second Stage Units (SSUs) were households in both rural and urban areas. The selection of FSUs and SSUs was done by simple random sampling without Replacement.
Key findings
Some interesting numbers revealed by the report include
- About 49.8% of households in the rural areas and about 92% in the urban areas used clean fuel such as LPG, other natural gas, gobar gas, other biogas, electricity, and solar cooker as the primary source of energy for cooking.
- Around 78.7% of the households in rural areas and about 97.1% in urban areas reported that the majority of household members had access to latrines.
- 29.3% of the persons in the age group 15-24 years were not in education, employment, or training (NEET) as of the date of the survey. This includes 30.2% in rural areas and 27% in urban areas.
- The survey covered the ability to perform different ICT skills of each of the surveyed persons of age 15 years and above using questions such as using copy-paste functions, knowledge of specialized programming language, applying arithmetic formulae in spreadsheets, and others. It was revealed that more youth in urban areas, especially males, possessed various ICT skills.
- The percentage of persons of age 18 years and above who had used a mobile telephone with an active sim card during the three months preceding the date of the survey was 83.7% in urban areas and 67.8% in rural areas.
- In rural areas, 92.5% of households reported that all-weather roads were available within 2 km of the place of living.
- Purchase/construction of any new house/flat since April 2014 was considered in the survey. A total of 9.2% of the households reported the purchase/construction of a new house/flat since April 2014. Among these households, 49.9% had purchased/constructed a new house/flat for the first time.
- About 29.1% of persons had a current place of residence different from the last usual place of residence.
Apart from the NSS survey reports, the Ministry of Finance, TRAI, and MoSPI released some reports in the last fortnight. The details of some of these reports have already been discussed in previous editions of the government data roundup by Factly.
Telecom Regulatory Authority of India (TRAI)
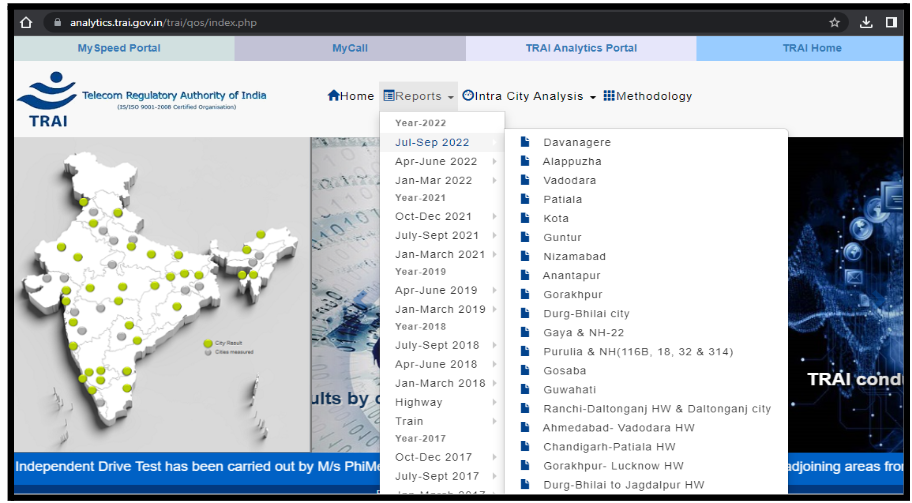
Report on Drive Tests in 20 Cities: Every quarter, TRAI conducts drive tests in different cities to assess the network quality provided by cellular mobile telephone service providers for voice and data services. For the quarter ending September 2022, the tests were performed in 20 cities. All the TSPs had met the Drop Call Rate (DCR) benchmark of 2% in Alappuzha, Vadodara City & Nearby area, Kota City and Nearby Area, Guntur, Anantapur, and Ahmedabad-Vadodara Highway NH-8. In Devanagere, BSNL 2G, BSNL 3G, and VIL 4G failed to meet the benchmark. Reliance Jio, Vodafone India Ltd, and Airtel failed in the quality of the 4G Network in Guwahati.
Ministry of Statistics and Programme Implementation
The reports released by MoSPI include the following.
- Periodic Labour Force Survey (PLFS) – Quarterly Bulletin [October – December 2022]: The survey underlines the importance of the availability of labour force data at regular intervals of time. The unemployment rate (in CWS) at the national level was 7.2% among people aged 15 years and above in urban areas, with 9.6% among urban females and 6.5% among urban males, in the quarter ending December 2022. The Labour Force Participation Ratio (in CWS) in urban areas was 48.2% among persons aged 15 years and above. It was 73.3% among males and 22.3% among females revealing a huge disparity across gender.
- Periodic Labour Force Survey (PLFS) – Annual Report [July, 2021 – June, 2022]: The PLFS annual report to estimate key employment and unemployment indicators highlights that India’s unemployment rate was 4.1% in 2021-22 as compared to 4.2% in 2020-21 and 4.8% in 2019-20. In urban areas, the unemployment rate was 6.3% and in rural areas, it was 3.2%. Meanwhile, the worker population ratio of females in rural areas had increased from 32.2% in 2019-20 to 35.8% in 2021-22, the same for urban females had improved from 21.3% to 21.9% during the same period.
- Payroll Reporting in India – A Formal Employment Perspective: The employment outlook of the country covering the period September 2017 to December 2022 gives different perspectives on the level of employment in the formal sector in the country. According to the data, about 13.73 lakh new members joined the Employees’ State Insurance Corporation’s scheme in December 2022 while 8.02 lakh new EPF subscribers were recorded in the same month. Between September 2017 to December 2022, around 6.18 crore new subscribers joined the Employees’ Provident Fund scheme.
- Second Advance Estimates of National Income, 2022-23, Quarterly Estimates of Gross Domestic Product for The Third Quarter (October-December), 2022-23 And First Revised Estimates of National Income, Consumption Expenditure, Saving and Capital Formation, 2021-22: As per the press note, India’s real GDP in the year 2022-23 is estimated to attain a level of Rs. 159.71 lakh crore, as against the First Revised Estimate of GDP for the year 2021-22 of Rs. 149.26 lakh crore. The growth in GDP during 2022-23 is estimated at 7% as compared to that of 9.1% in 2021-22. Details of the Advance estimates of national income are available here.
Monthly GST Revenue Collections and the Monthly Review of Accounts of Union Government of India
The Ministry of Finance released the Monthly GST Revenue Collections and the Monthly Review of Accounts of the Union Government of India through a press release.
- Monthly GST Revenue Collections: India’s gross GST revenue collection was Rs. 1,49,577 crores in February 2023. This was 12% higher than that in February 2022. As compared to February 2022, revenues from the import of goods were 6% higher and the revenues from the domestic transaction (including the import of services) were 15% higher. Further, the collection of cess was the highest in this month since the implementation of GST. The revenue collection in February is usually less since it has only 28 days.
- Monthly Review of Accounts of Union Government of India: The Government of India received Rs. 19,76,483 crores up to January 2023 including Rs. 16,88,710 crore Tax Revenue (Net to Centre), Rs. 2,30,939 crores of Non-Tax Revenue and Rs. 57,194 crores of Non-Debt Capital Receipts. The total Expenditure incurred by the Government of India was Rs. 31,67,648 crores. Of this, Rs. 7,38,658 crore is on account of Interest Payments and Rs. 3,99,400 crore is on account of Major Subsidies.
Featured Image: Government Data Roundup

