The seventeenth edition of the fortnightly government data roundup covers reports released by NITI Aayog, Ministry of Finance, TRAI, Registrar General of India, GDP estimates among others.
Multiple reports were released in the last fortnight from 19 November 2022 to 02 December 2022. In this 17th edition of Factly’s fortnightly government data roundup, we look at the reports released by NITI Aayog, Ministry of Finance, TRAI, Registrar General of India among others. These include both reports that are released frequently and one-time reports.
In addition to the new reports that will be discussed in detail in this story, regular reports such as Quarterly GDP Estimates and monthly EPF Payroll reporting in India which have been discussed in the previous editions of the roundup, were also released in the last fortnight. Highlights from the two reports are as follows:
- Quarterly GDP Estimates covering the first half of 2022-23 was released. Real GDP or GDP at Constant (2011-12) Prices in Q2 of 2022-23 is estimated at ₹38.17 lakh crore, as against ₹35.89 lakh crore in Q2 of 2021-22, showing a growth of 6.3% as compared to 8.4% in Q2 of 2021-22
- According to EPF Payroll data, EPFO has added 16.82 lakh net subscribers in the month of September 2022, which is an increase of 9.14% in membership as compared to September 2021. Compared to the monthly average that was recorded during the last financial year, the net enrolment during the month has increased by 21.85%.
SRS Special Bulletin on Maternal Mortality in India 2018-20
| Report name | Sample Registration System (SRS) – Special Bulletin on Maternal Mortality in India 2018-20 |
| Sector | Demography |
| Agency responsible | Registrar General of India (RGI) |
| Frequency of release | Annual |
| Source Link | Sample Registration System (SRS)-Special Bulletin on Maternal Mortality in India 2018-20 |
Brief about the report
One of the key indicators of maternal mortality is the Maternal Mortality Ratio (MMR) which is defined as the number of maternal deaths during a given period per 100,000 live births during the same period. The Office of the Registrar General, India under the Ministry of Home Affairs, provides estimates on fertility and mortality using the Sample Registration System (SRS). SRS is one of the largest demographic sample surveys in the country that among other indicators provides direct estimates of maternal mortality through a nationally representative sample. The recently released bulletin provides the statistics on maternal mortality for the period 2018-2020.
In the report, States have been categorized into three groups:
- Empowered Action Group (EAG) States and Assam- Bihar, Jharkhand, Madhya Pradesh, Chhattisgarh, Odisha, Rajasthan, Uttar Pradesh, and Uttarakhand, and Assam
- Southern States- Andhra Pradesh, Telangana, Karnataka, Kerala, and Tamil Nadu
- Other States- the remaining 15 States such as Northeastern states, Gujarat, Maharashtra, etc. and the UTs
Key Findings
- The maternal Mortality Ratio in India has declined over the years to 97 in 2018-20 from 103 in 2017-19 and 130 in 2014-2016
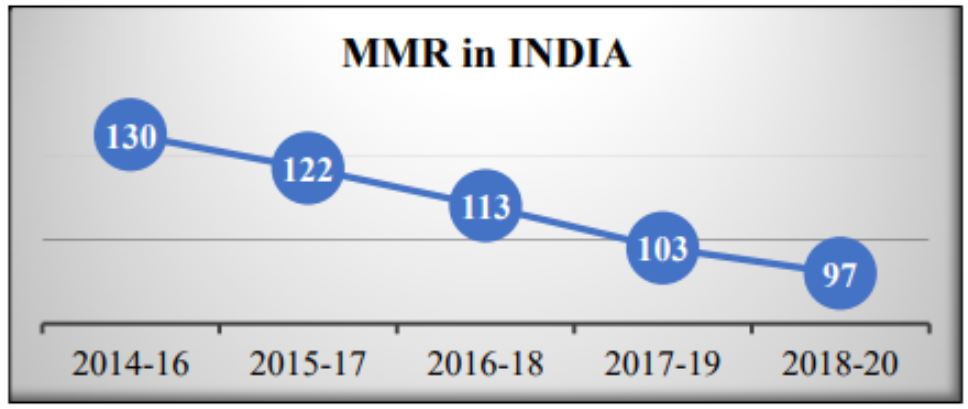
- Upon achieving this, India has accomplished the National Health Policy (NHP) target for MMR of less than 100/lakh live births.
- As per the SDG targets, India should bring down MMR to less than 70/ lakh live births by 2030. However, 8 states including the 5 southern states have already achieved this target; Kerala (19), Maharashtra (33), Telangana (43) Andhra Pradesh (45), Tamil Nadu (54), Jharkhand (56), Gujarat (57) and Karnataka (69) have already achieved the SDG targets.
- MMR in the EAG States and Assam is 137, much higher than the national level. It is as high as 173 in Madhya Pradesh and 167 in Uttar Pradesh.
Carbon Capture, Utilisation, and Storage (CCUS) Policy Framework and its Deployment Mechanism in India
| Report name | Carbon Capture, Utilisation, and Storage (CCUS) Policy Framework and its Deployment Mechanism in India |
| Sector | Climate Change |
| Agency responsible | NITI Aayog |
| Frequency of release | – |
| Source Link | Carbon Capture, Utilisation, and Storage (CCUS) Policy Framework and its Deployment Mechanism in India |
Brief about the report
The International Energy Agency (IEA) defines Carbon Capture, Utilization and Storage (CCUS) as a group of technologies for capturing of Carbon dioxide (CO2) from large and stationary CO2 emitting sources, such as fossil fuel-based power plants and other industries. CCUS also involves the transport of the captured CO2 to sites, either for utilization in different applications or injection into geological formations or depleted oil & gas fields for permanent storage and trapping of the CO2. Identifying the need for CCUS to produce clean products and energy in India, NITI Aayog published a report which explores the importance of CCUS as an emission reduction strategy to achieve deep decarbonization from the hard-to-abate sectors. The report also outlines broad-level policy interventions needed across various sectors for its application.
Key findings
- CCUS can provide a wide variety of opportunities to convert the captured CO2 to different value-added products like green urea, food, and beverage form application, building materials (concrete and aggregates), chemicals (methanol and ethanol), polymers (including bioplastics) and enhanced oil recovery (EOR) with wide market opportunities in India, thus contributing substantially to a circular economy.
- Lack of any policy incentives and framework, lack of a viable or established business model with independent players providing services for the transportation and disposition of CO2 and lack of established pathways & options for the utilization or storage of CO2 at scale have been identified as impediments for companies to invest in CCUS Projects.
- It also suggests that India should design and establish a robust and effective CCUS policy framework to enable projects across the CCUS value chain and at scale for the major industrial sectors of the Indian economy like power, steel, cement, chemicals, and petrochemicals.
Monthly Progress and Achievement Report of UIDAI
| Report name | Monthly Progress and Achievement Report- UIDAI |
| Sector | Information Technology |
| Agency responsible | UIDAI |
| Frequency of release | Monthly |
| Source Link | Monthly Progress and Achievement Report- UIDAI |
Brief about the data
Every month, the Unique Identification Authority of India (UIDAI) releases data on the monthly Aadhar adoption, and transactions done using Aadhar such as Aadhar-enabled Payment Systems (AePS), e-KYC, Aadhar Authentication, etc. through a press release. This data is significant since Aadhar is increasingly being used for the implementation of various schemes by State and Union governments. So far, over 1100 welfare schemes in the country run by both centre and states have been notified to use Aadhaar since it helps various ministries and departments in improving efficiency, transparency, and delivery of welfare services to the targeted beneficiaries.
Key findings
- Over 175.44 crore authentication transactions were carried out via Aadhaar in October 2022.
- 23.56 crore e-KYC transactions were executed using Aadhaar in October 2022, and the cumulative number of e-KYC transactions via Aadhaar has now gone up to 1321.49 crores by the end of October 2022.
- October 2022 also recorded 23.64 crores of AePS transactions across India, up by 12.4% when compared with September 2022. Cumulatively, 1573.48 crores of last-mile banking transactions have been made possible via the use of AePS and the network of micro-ATMs so far, by the end of October 2022.
Indian Telecom Services Performance Indicator Report
| Report name | Indian Telecom Services Performance Indicator Report |
| Sector | Telecommunications |
| Agency responsible | Telecom Regulatory Authority of India (TRAI) |
| Frequency of release | Quarterly |
| Source Link | Indian Telecom Services Performance Indicator Report |
Brief about the report
The report provides a broad perspective of the Telecom Services in India and presents the key parameters and growth trends of the Telecom Services as well as Cable TV, DTH & Radio Broadcasting services in India for the period covering the quarter from April to June 2022. It has been compiled mainly on the basis of information furnished by the Service Providers.
Key findings
- The number of telephone subscribers in India increased from 1,166.93 million at the end of March 2022 to 1,172.96 million at the end of June 2022, registering a growth rate of 0.52% over the previous quarter. The overall Tele-density in India increased from 84.88% in the quarter ending March 2022 to 85.13% in the Quarter ending June 2022.
- Telephone subscribers in Urban areas increased from 647.11 million at the end of March 2022 to 649.09 million at the end of June 2022. But the Urban Tele-density decreased from 134.94% to 134.72% during the same period.
- Rural telephone subscribers increased from 519.82 million at the end of March 2022 to 523.27 million at the end of June 2022 and Rural Tele-density also increased from 58.07% to 58.46% during the same period.
- The performance of Cellular Mobile service providers in terms of Quality-of-Service performance in all the parameters remains same. There has been neither improvement nor deterioration in the performance in this quarter, as compared to the previous quarter.
Consultation Paper on ‘Introduction of Calling Name Presentation in Telecommunication Networks’
| Report name | Consultation Paper on ‘Introduction of Calling Name Presentation in Telecommunication Networks’ |
| Sector | Telecommunications |
| Agency responsible | Telecom Regulatory Authority of India (TRAI) |
| Frequency of release | – |
| Source Link | Consultation Paper on ‘Introduction of Calling Name Presentation in Telecommunication Networks’ |
Brief about the report
The Telecom Regulatory Authority of India (TRAI) on 30 November 2022, released a Consultation Paper on ‘Introduction of Calling Name Presentation (CNAP)’ in Telecommunication Networks. The CNAP facility in telecommunication networks is expected to help subscribers to decide on receiving an incoming call, and to reduce the harassment of subscribers from unknown/spam callers.
Key points raised
Here are some important points put forward by TRAI in the paper
- To facilitate CNAP features to all telephone subscribers (smartphone and feature phone owners) in India, the telecom network’s readiness and feasibility need to be explored so that CNAP can be implemented in multi-technology networks across telecom service providers without the need for internet or smartphones/devices.
- CNAP facility requires inter-telecom service provider coordination and access to a subscriber’s name during the call flow. Further, the authority was asked to carry out a consultation process to resolve some of the important issues as mentioned below:
- Inter-service provider subscriber name access mechanism.
- Modification in the call flow process for inclusion of the subscriber’s name during call completion.
- Requirement of storage and retrieval of calling party name at terminating network.
- Technology-neutral caller name display facility of the telecommunication subscribers.
- Internet independent caller name display facility of the telecommunication subscribers.
- Delivery of subscriber name to called party without hindering latency of existing call flow mechanism.
- Issues have also been put forth for various stakeholders to respond to in the last chapter. The comments/counter-comments may be sent in electronic form at advmn@trai.gov.in. For any clarification/information, Akhilesh Kumar Trivedi, Advisor (Networks, Spectrum and Licensing), TRAI may be contacted at Telephone Number +91-11-23210481. Written comments on the issues raised in the Consultation Paper are invited from the stakeholders by 27 December 2022 and counter-comments by 10 January 2023.
Working paper on Freedom in the World Index, V-DEM indices, and EIU Democracy Index
| Report name | Working paper on Freedom in the World Index, V-DEM indices, and EIU Democracy Index |
| Sector | Perception-based indices |
| Agency responsible | Economic Advisory Council to the Prime Minister (EAC-PM) |
| Frequency of release | – |
| Source Link | Working paper on Freedom in the World Index, V-DEM indices, and EIU Democracy Index |
Brief about the paper
Noting the decline of India’s rankings on several global indices, specifically in opinion-based indices that deal with subjective issues such as democracy, press freedom, etc., the Economic Advisory Council to the Prime Minister (EAC-PM) has come up with this working paper to study the reasons behind it. This topic has been taken up by the Council since these indices are inputs into the World Bank’s World Governance Indicators (WGI). These indices are also used in ESG indicators which are given due consideration for investment and trade.
Three indices- Freedom in the World Index, Economist Intelligence Unit (EIU) Democracy Index and V-DEM indices have been studied in the report which are almost entirely based on perceptions.
Reasons highlighted in the paper
There are serious problems with the methodology used in these perception-based indices which affect the results according to the paper. These are listed below.
- The indices are primarily based on the opinions of a tiny group of unknown “experts”. The institutions do not provide any transparency on how the experts are chosen or their expertise.
- The questions that are used are subjective and structured in a way that is impossible to answer objectively even for a country, let alone compare across countries. Hence, simply providing the same set of questions to everyone does not necessarily lead to comparable scores across countries.
- There are questions that should be asked but are excluded such as “Is the head of state democratically elected?”. Such an inclusion would sharply reduce scores for countries such as Sweden, Norway, the UK, Denmark, Belgium, and the Netherlands which are constitutional monarchies. Not only is such a question pertinent to a measure of democracy, but it can also be answered objectively.
- Certain questions used by these indices are not an appropriate measure of democracy across all countries.
Featured Image: Government Data Roundup

