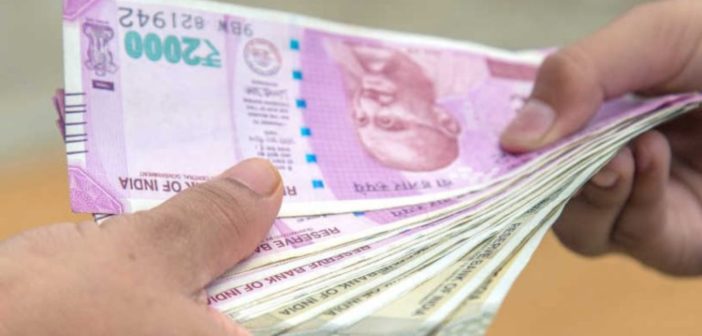
The RBI’s annual ‘Handbook of Statistics on the Indian Economy’ offers an extensive collection of macroeconomic and financial data related to national income, production, pricing, currency, banking, financial markets, government finances, among others. Data from this indicates that market borrowings of the central government more than doubled post the COVID year of 2019-20.
The Reserve Bank of India’s annual ‘Handbook of Statistics on the Indian Economy’ offers an extensive collection of macroeconomic and financial data related to national income, production, pricing, currency, banking, financial markets, government finances, international trade, balance of payments, and specific socio-economic metrics. Since 1998, this publication has been highly anticipated by researchers for understanding the functioning of the Indian economy. The year 2022-23 marks the 25th edition of this publication.
In this respect, we look at some of the aspects of the Indian economy, primarily focusing on the Central Government’s sources of revenue and streams of expenditure. For a better understanding of the classifications, refer to the explanatory notes (Table no 93 to 96).
Total Receipts of Central Governments at Rs. 45 lakh crores in 2023-24
The Central Government has three primary sources of receipts:
- Direct taxes such as income tax, corporation tax, etc.
- Indirect taxes such as excise duties, customs duties, GST, etc.
- Non-tax revenue such as interest receipts and dividend payments
- Capital receipts such as disinvestment proceeds, and borrowings.
Among the major components of the central government’s receipts, it is observed that the net tax revenue (both direct and indirect) accounts for almost 50% of the total receipts of the Central Government in 2022-23 whereas non-tax revenue accounted for 6%. In terms of capital and revenue receipts, capital receipts account for almost 45%, while revenue receipts account for the rest.
It is also observed that there is a steady growth in central government receipts since 1990. However, between 2019-20 and 2020-21, the total receipts jumped by around 30%, when the average growth rate prior to that was around 13%. In absolute terms, the total receipts grew from Rs. 26.8 lakh crores to Rs. 35.2 lakh crores during this period. The majority of this growth can be attributed to the rise in capital receipts from Rs. 9.9 lakh crore to Rs. 18.8 lakh crore.
The total receipts further grew steadily to Rs. 41.9 lakh crore as per the revised estimates in 2022-23 and Rs. 45.1 lakh crore as per the budget estimates for 2023-24.
Huge jump in market borrowings in recent years
It is evident that capital receipts contributed significantly to the rise in total receipts. Capital receipts consist of these major components: market borrowings, small savings, Provident funds, Special deposits, Recovery of loans, Disinvestment receipts, and External loans. Analysing the component-wise growth in capital receipts, it can be seen that market borrowings accounted for approximately a 60% rise in capital receipts, followed by small savings and external loans. In absolute terms, the market borrowings grew by nearly 120% from Rs. 4.7 lakh crores to Rs. 10.3 lakh crores between 2019-20 and 2020-21. Small savings also grew double from Rs. 2.4 lakh crore to Rs. 4.8 lakh crore during the same period. Together, these two components accounted for 90% of the growth in capital receipts in this period. After a brief fall in 2021-22, these two components grew in subsequent years.
Revenue Expenditure accounts for 85% of the total central government expenditure
Capital expenditures, often referred to as capex, represent the funds spent on valuable assets that serve long-term needs. On the other hand, revenue expenditures encompass expenses that do not lead to asset creation and are usually short-term expenses.
It is observed that revenue expenditure grew from Rs. 27,691 Crores in 1984-85 to Rs. 35,02,136 Crores (Budget Estimates) in 2023-24. Similarly, the capital expenditure grew from Rs. 15,941 Crores to Rs. 10,00,961 Crores (Budget estimates) during the corresponding period. While the revenue expenditure increased by 125 times, the capital expenditure increased by only half, 62 times.
Out of the total expenditure of the central government, the share of revenue expenditure grew from 63% to 78%, while capital expenditure fell from 37% to 22%. Almost one-third of the total revenue expenditure is towards interest payments, followed by defence expenditure at 6%. Further, more than 80% of the capital expenditure is towards capital outlay, out of which expenditure on defence accounts for one-fourths.
Share of development and non-development expenditure is almost same
The budgets of both central and state governments are crafted with the aim of boosting economic development and progress. The expenditure pattern of the central government reveals that the share of development and non-development expenditure is almost equal. The development expenditure stood at Rs. 82,803 Crores in 1994-95, which rose to Rs. 22,63,291 Crores in 2023-24, while non-development expenditure grew from Rs. 82,402 Crores to Rs. 22,39,807 Crores during the same period.
Out of the total development expenditure, the share of expenditure on economic services grew from 41% to 66% while the share of expenditure on social services grew from 7% to 10.8% during the same period.


