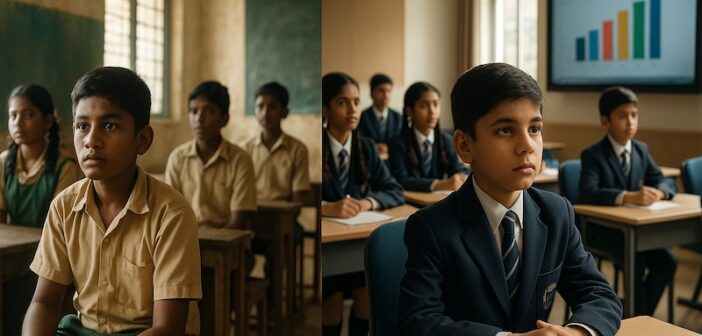
TL; DR: The Indian education system reflects a tale of two worlds. Family Income and geography seem to dictate which children get real opportunities. The numbers do not just show spending patterns; they tell us who gets ahead and who gets left behind.
Context:
India’s classrooms are changing, but the transformation isn’t what policymakers promised. Behind every classroom sits a story of inequality. Education today is less a guaranteed right and more an economic divide, and the latest CMS: Education Survey 2025 captures this widening divide in India’s learning landscape.
Who compiles this data?
The Comprehensive Modular Survey: Education (CMS:E) was conducted by the National Statistics Office (NSO), Ministry of Statistics and Programme Implementation (MoSPI) from April–June 2025 as part of the 80th NSS round. It tracked the household spending on schooling, private coaching, and related costs, offering insights by gender, sector, and school type.
Where can I download clean & structured data related to CMS Survey on Education?
Clean, structured, and ready-to-use datasets on Education in India can be downloaded from Dataful. Data from multiple other sources, such as UDISE+, and previous NSS surveys, can also be found here.
Key Insights:
- Two Indias in one classroom: While 66% of rural children still study in government schools, in cities the story flips, with over 51% of urban students in private unaided schools, reflecting a deep rural–urban divide in educational choices.
- The price of schooling isn’t uniform: Families spend barely ₹3,000 per child annually in government schools, but this increases to nearly ₹29,000 in private unaided schools, a tenfold gap that reveals how education in India is as much an economic decision as an academic one. Even within families, boys see higher investments (₹13,901 vs ₹12,101 for girls), exposing subtle yet persistent gender gaps in investment.
- Where the money goes in schooling: The biggest cost is the course fee, averaging ₹12,457 per child, but urban families pay far more (₹19,457) than rural ones (₹8,120). Transportation (₹5,532) and textbooks (₹2,097) add up, while uniforms (₹1,657) remain the smallest slice, underscoring how both geography and gender shape the real cost of learning.
Why does it matter?
The data from the survey shows that access to better educational facilities is decided based on where you live and what your family can afford.
These gaps, by geography, gender and price, translate into unequal opportunities. When a child’s access to education is determined by what a family can pay, education becomes a function of wallet, not a right.
Key numbers:
- Distribution of students currently enrolled in schools by type of school
- Rural: Government (66%), Private Unaided (24%), Private Aided (9%)
- Urban: Government (30%), Private Unaided (51%), Private Aided (18%).
- Average Expenditure (₹) per reported student on education by type of school
- Rural: Government (2,801), Private Unaided (22,919), Private Aided (11,244)
- Urban: Government (4,374), Private Unaided (35,798), Private Aided (20,792).
- Average Expenditure (₹) per reported student on education by items of expenditure
- Rural: Course Fee (8,120), Transportation (4,650), Stationary/ books (1,753)
- Urban: Course Fee (19,457), Transportation (7,041), Stationary/ books (2,962)


