The recently released National Achievement Survey (NAS) 2021 by the Ministry of Education indicated a broad decline in learning outcomes at almost levels compared to NAS 2017. But what are these surveys all about? What do they measure and how reliable are the results?
Education is the primary force in fostering human capital. It is the most vital weapon in any country’s fight against poverty. Education enables socio-economic mobility and aids in the transformation of people’s lives. Ensuring quality and inclusive education is one of the basic prerequisites for the overall sustainable development of any nation.
Education has a domino effect on many aspects of people’s lives. In the present scenario, an applicant with better education and skills is preferred over an applicant with minimal education. The former is most likely to have better employment opportunities- jobs that pay higher and provide other benefits such as insurance, and paid leaves. In most cases, the reverse causality is also true – children with ill health and poor living conditions are most likely to have barriers to better educational attainment and often face educational setbacks.
Acknowledging the multi-sectoral gains of education, nations across the world had made progress towards ensuring inclusive and quality education for all, in the past few decades. Despite this advancement, a significant section of the global population of children and youth stay out of school. And many do not even possess the basic proficiency standards in mathematics and reading. Adding to these existing deficiencies, the temporary shutdown of schools during the COVID-19 pandemic had further increased this learning gap. The already marginalized and vulnerable communities, across the globe and in India, bore the brunt of the pandemic-induced closure of schools and widening of the existing learning gap.
In this context, the recently released National Achievement Survey (NAS) 2021 by the Ministry of Education holds significance. Today’s story looks at NAS 2021 comprehensively and cross-validates the results with the existing evidence from other data sources.
Tracing the evolution of NAS
National Achievement Survey is a nationwide competency-based assessment to gain insights into the learning outcomes of school children. The assessment examines the learning outcomes of the children of classes 3, 5, 8, and 10 studies in both private and government schools. For classes 3 and 5, the assessment is done on Language, Mathematics and Environmental studies; for class 8, Language, Mathematics, Science and Social Sciences; and for class 10, Modern Indian Language, Mathematics, Science and Social Science, and English are chosen for the assessment. The primary objective of such assessment is to gauge the effectiveness of school education and guide policymakers and planners to initiate suitable measures for reforming education.
The NAS was originally planned to be an independent project of NCERT but got incorporated under the Sarva Shiksha Abhiyaan (SSA) under the Ministry of Human Resource Development (MHRD) in 2000. Under this, it was originally planned to administer NAS for classes 3, 5, and 8 in three cycles- Cycle 1, also called the Baseline Achievement Survey (BAS) in 2001-04, and Cycle 2, also called the Mid-term Achievement Survey (MAS) in 2005-08, and Cycle 3, also called the Terminal Achievement Survey (TAS) in 2009-13. The NAS was later extended to cover class 10 in 2015 under the Rashtriya Madhyamik Shiksha Abhiyaan (RMSA). The 2017 cycle is the first comprehensive and new model of assessment developed based on the learning outcomes of the NCERT. It is for the first time in 2017, the NAS was conducted in a single day for all the classes, and districts were used as units for sampling. The key differences are highlighted below.

In 2017, around 2.2 million children from 1,10,000 schools from districts all over India were chosen for assessment, whereas in 2021, around 3.4 million children and more than 0.5 million teachers from 1,18,274 schools from all over India were chosen. This indicates a more expanded survey sample.
NAS 2021 indicates a decline in performance from NAS 2017
The 2021 NAS survey is vital in two aspects:
- It is a more expanded survey compared to 2017 as indicated above.
- The contextual importance of the survey (in light of the COVID-19 pandemic)
The comparison of the NAS 2021 survey results with that of 2017’s survey results highlights the disruptions caused by the pandemic in children’s education. Results of the two surveys indicate that, for classes 3, 5, and 8, the mean score in all subjects in NAS 2021 showed a decline compared to the 2017 NAS Survey. For Class 10, except for English and Modern Indian Language, the rest of the subjects in class 10 showed a decline in their performance in NAS 2021 compared to the 2017 NAS Survey. Even among the improvement, English showed high improvement than the Modern Indian Language. Similarly, the maximum decline in performance is seen in the Science and Mathematics of class 10.
Other important observations in NAS 2021 survey
As stated earlier, this survey assumes significance because of the COVID-19 pandemic. Many schools were temporarily closed in the initial stages of the pandemic. In the later stages, these started adapting online teaching as the primary mode of teaching. The existing digital divide has widened and children without access to the internet or smartphone were left out during this transition.
In the NAS 2021 survey, 24% of the students did not have any digital device at home. Nearly 38% of the students faced difficulty in learning through online mode. Around 45% felt it was joyful, while 50% claimed no difference in learning. 78% of the students felt online learning was burdensome with more assignments. In terms of ease of learning, 80% felt that they learn better in schools with peer learning and 70% claimed that online learning took relatively more time to learn new things.
An overwhelming majority of the children commute to school by walk and by bicycle. Among the teachers sampled, 65% of the teachers feel that they are overloaded with work, while 44% claim that they do not have adequate workspace highlighting the lack of infrastructure in the schools. In the profile of sampled schools, 17% of the schools highlight the lack of space in the classrooms, while 7% of the schools’ face teacher absenteeism. 25% of the schools claim that they lack parental support in student learning. This lack of parental support in student learning is driven by the educational status of parents. Around 18% of the mothers cannot read and write, while 27% studied up to secondary and higher secondary levels. Only 12% of the mothers are graduates and above, validating the lack of parental support for student learning. In the 2017 survey, this was done using statistics to study positive and negative correlations with these background variables that can impact the education and learning outcomes of the students.
The report also highlights the performance divide between the rural and urban areas, where urban areas perform relatively better than rural areas. It also points out the low performance of students from Scheduled Castes and Scheduled Tribes compared to the students from the general category. One positive aspect of this survey is that girls outperform boys in the majority of the subjects at all class levels.
Many assessments, one key question – ‘Reliability’ of data
Various organizations conduct different kinds of assessments to understand the educational outcomes of the children. Among the different assessments, the Annual Survey of School Education (ASER) by the Non-governmental Organization (NGO) Pratham, is the largest household survey conducted to understand the enrolment level for children aged between 3-16 and the learning outcomes of children aged 5-16. The ASER (Rural) 2021 surveyed around 75,234 children aged 5-16 and more than 7200 schools were surveyed. The ASER data must be examined with caution as it contains information about students from all classes, while NAS has data of only classes 3, 5, 8, and 10, and the sample size is much lower.
Among the important parameters surveyed, the availability of smartphones at home is vital as many schools transitioned towards online education. The ASER (Rural) 2021 survey notes that around 68% of the students have at least one smartphone available at home. This is nearly the same result in the NAS 2021 survey which estimated the non-availability of at least one smartphone at home to be at 24%. In terms of receiving parental guidance or family help in studying at home or learning, the ASER (Rural) 2021 survey pegs this at 67%, while the NAS 2021 survey estimation is 75%.
In terms of remote learning, the ASER (Rural) 2021 survey found that around 24% of children did online activities at home, and among them, around 51% found it easier than in 2020. The NAS 2021 had contrasting findings, with around 38% finding it difficult to learn in online mode.
Consider the example of West Bengal. Below is the NAS 2017 survey result.
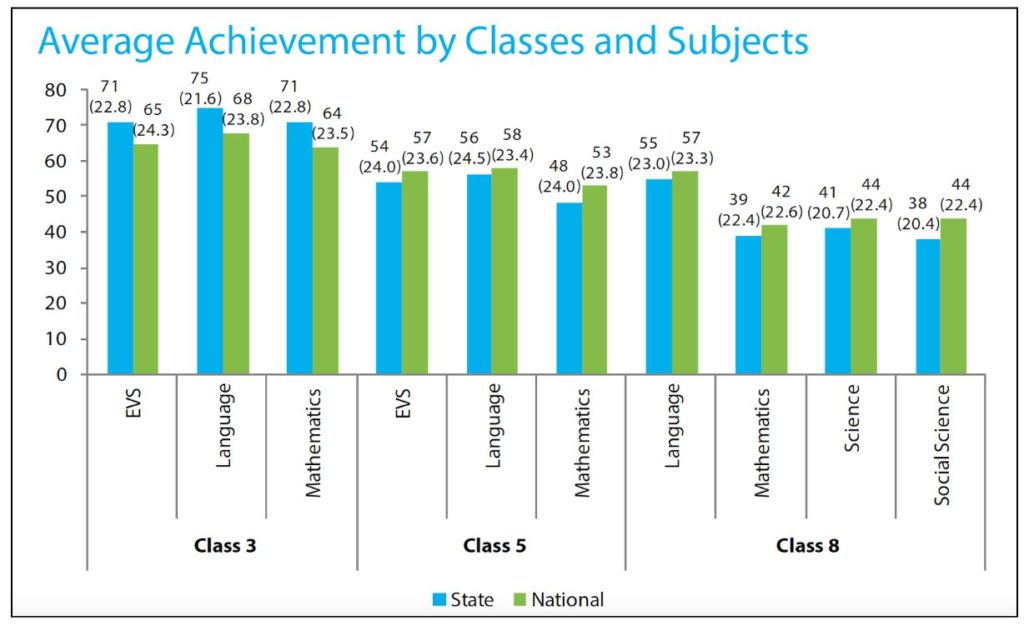
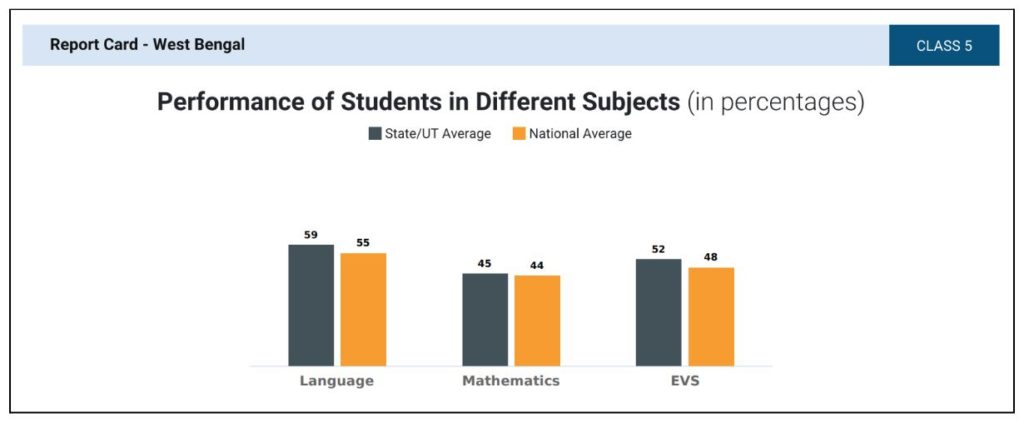
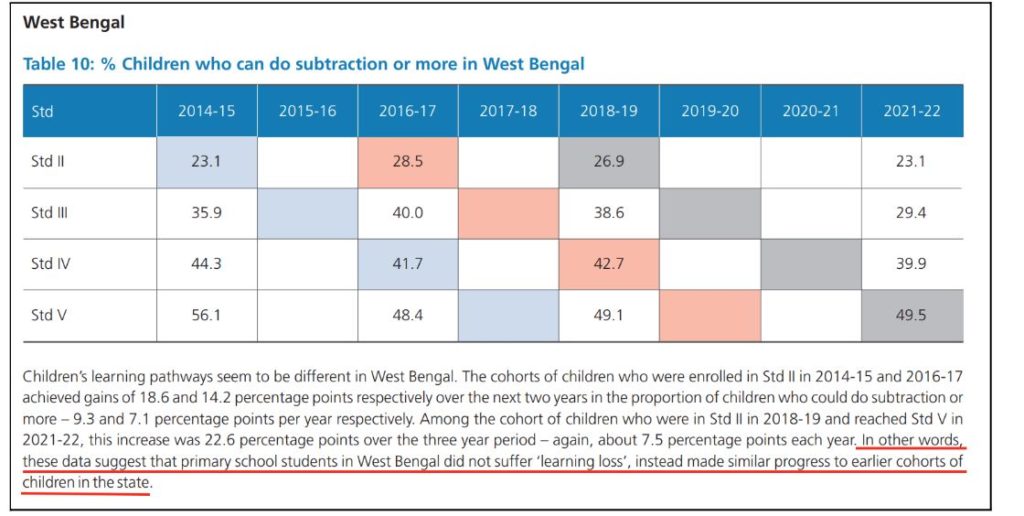
The class 5 score in Mathematics fell from 48 in NAS 2017 to 45 in NAS 2021. Particularly, the learning outcomes for children who can solve simple problems using addition and subtraction fell from 66 in 2017 to 51 in 2021. However, in the ASER Survey on the status of learning from West Bengal, a student enrolled in Standard II in 2018-19 could have reached standard V in 2021-22. The % of children who can do subtraction or more increased by over 23 percentage points, indicating that West Bengal did not suffer any ‘learning losses.’
This is just an example of how different assessments provide different results. A similar analysis for Rajasthan by a Journalist Samarth Bansal showed glaring differences in the NAS scores and the actual ground realities. The report quotes Krishna Kumar, former director of NCERT, who is vocal against standardized testing and outcome-driven approach, in the absence of consideration of the socio-economic background of the children. The comparative analysis between ASER and NAS 2021 is looked at in detail in our earlier stories here. A detailed examination of reliability of data on Indian learning outcomes by IDR finds some issues with the reliability of these different survey results.
Another assessment that measures the learning competency of the children is the Programme for International Students Assessment (PISA), conducted by Organization for Economic Cooperation and Development (OECD). It is held every three years, for children aged between 15-16 and India participated only once in 2009. In that assessment, India ranked 72 of the 73 countries that participated. India stayed away from such assessment later, while in 2018, India announced its willingness to participate in PISA 2021 assessment. It got postponed to 2022 due to the COVID-19 pandemic.
Surveys should guide Policy actions
Different assessments follow different methodologies to arrive at the results. Their research methods including a selection of sampling frame, sample size, use of different kinds of sampling techniques, normalization formulae, and benchmark settings result in different results. It is not possible to conclusively state which methodology is proper and comprehensive and which isn’t. Nevertheless, even with these differences, it is generally expected that the results match & reflect nearly the ground realities. However, more often they do not. Hence, the disagreements and debates on the authenticity of the surveys themselves. It is also important to not fall into the trap of race to statistics but provide more meaningful solutions to the problems underlying the education sector. Irrespective of the type of assessment used, it is possible to improve the learning outcomes only when these results guide policy planning and subsequent actions. Until then, any number of surveys remain just a formal exercise, with no real value in terms of change.
Featured Image: National Achievement Survey 2021

