[orc]Various parts of the country are facing a severe water crisis. Data reveals that the crisis is getting worse by the day. The per capita water availability in the country has come down by 70% in 60 years from 1951 to 2011. Even the 2011 survey by the Central Ground Water Board indicates that ground water is over exploited in one out of every six assessed units.
Various parts of the country are reeling under a severe drought and a water crisis. Data also reveals that the situation is getting worse by the day. The per capita water availability in the country has come down 70% from 1951 to 2011, in a span of 60 years. While growth of population is one of the reasons for this, the over exploitation of ground water coupled with lack of harvesting is making matters worse.
Requirement would reach 1447 BCM by 2050
The average annual water availability in the country has been assessed as 1869 billion cubic meters (BCM). The total water requirement for various uses like agriculture, industrial and domestic uses etc. in the country has been assessed by the ‘Standing Sub-Committee for Assessment of Availability and Requirement of Water for Diverse Uses in the Country’ to be about 813 BCM, 1093 BCM, and 1447 BCM by the year 2010, 2025 and 2050 respectively. However, the National Commission for Integrated Water resources Development has assessed that with achievement of the desired level of efficiency, the water requirement by the year 2010, 2025 and 2050 will be about 710 BCM, 843 BCM and 1180 BCM respectively. Bulk of this requirement would be for irrigation. As per the Central Water Commission, only 1123 BCM of water is utilizable out of the available water including surface and ground water resources.
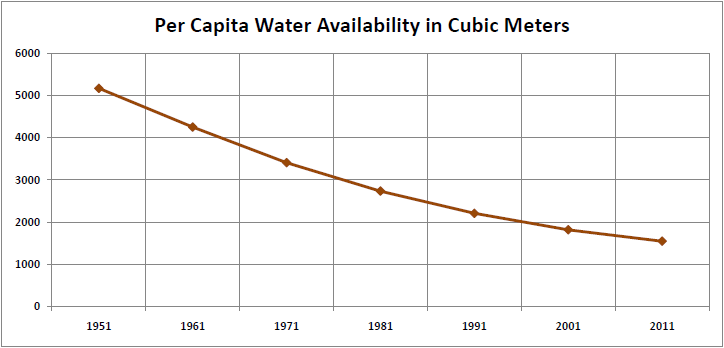
Per Capita Water Availability in 2011 is 1545 Cubic Meters
The per capita water availability in the country is reducing due to increase in population. The average annual per capita availability of water taking into consideration the population in various census has come down 70% from 1951 to 2011, in a span of 60 years. The per capita availability of water as per 1951 census was 5177 cubic meters. This is down to 1545 cubic meters as per 2011 census. As per the 2001 census, it was 1816 cubic meters. It has continuously decreased owing to the increase in population.
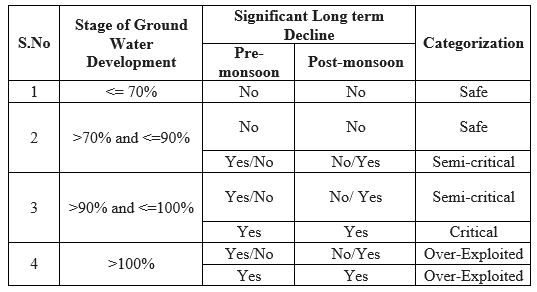
What is an over exploited area?
Central Ground Water Board (CGWB) categorizes various assessed units into Over-exploited, Critical etc based on the stage of ground water development and the long-term trend of pre- and post-monsoon groundwater levels. The stage of ground water development is a ratio of Annual Ground Water Draft and Net Annual Ground Water Availability in percentage. Present stage of ground water development in the country is 58%. The following are the four categories as defined by CGWB based on the criteria mentioned above
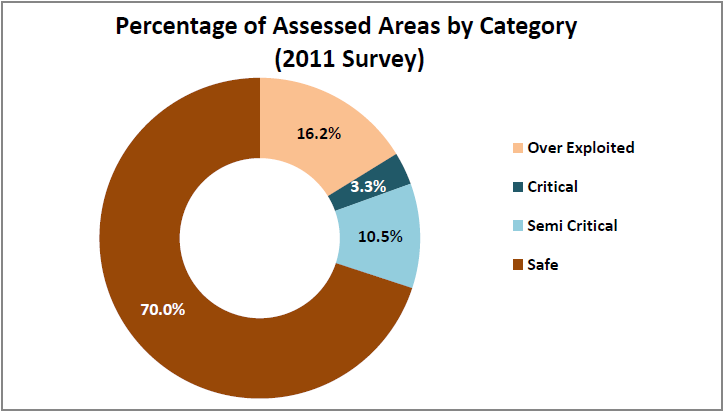
One in every Six assessed blocks is over exploited in ground water
The latest assessment of Dynamic Ground Water Resources was carried out jointly by Central Ground Water Board (CGWB) and the State Governments in 2011. Out of 6607 assessed units (Blocks/ Mandals/ Talukas) in the Country, 1071 units falling in 16 States and 2 UTs have been categorized as ‘Over-Exploited’. 217 assessed units are ‘Critical’ and 697 are ‘Semi-Critical’. In other words, one out of every six assessed units is over exploited while 3 out of every 10 assessed units are not safe. Overall, 30% of the assessed units are in over-exploited, critical or semi critical state.
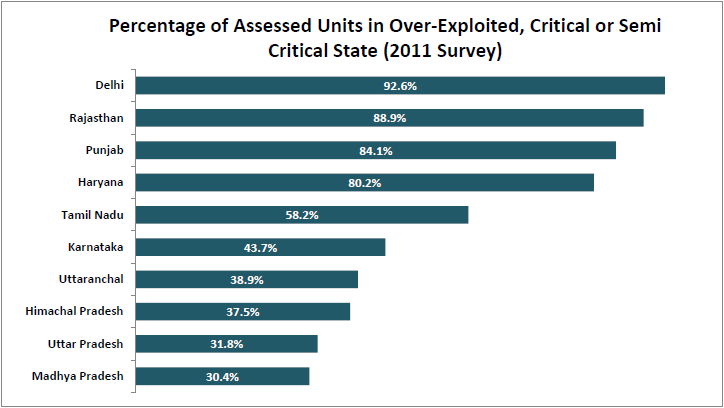
Delhi & Rajasthan at the top of Ground Water Exploitation
Within the states, 92.6% of the assessed units in Delhi are in over-exploited, critical or semi critical state. Rajasthan is a close second with 88.9% of the assessed units in such a state. In both Punjab and Haryana, more than 80% of the assessed units are in such a state. More than 30% of the assessed units are not in a safe state in 10 of the states. In Bihar, only 2.1% of the assessed units are in such a state while in Odisha, all the 314 assessed units were found to be safe.
Featured Image: By Daniel Bachhuber


2 Comments
Pingback: Itzchak Kornfeld's Environment and Natural Resources Blog
Pingback: per capita availability - Shanmugam IAS academy in coimbatore