Soon after the GDP growth for quarter-1 of 2019-20 was known to be a poor 5%, the Congress party uploaded an infographic with a bunch of claims on GDP growth, Unemployment rate, Exports growth etc. Here is a fact check of these claims.
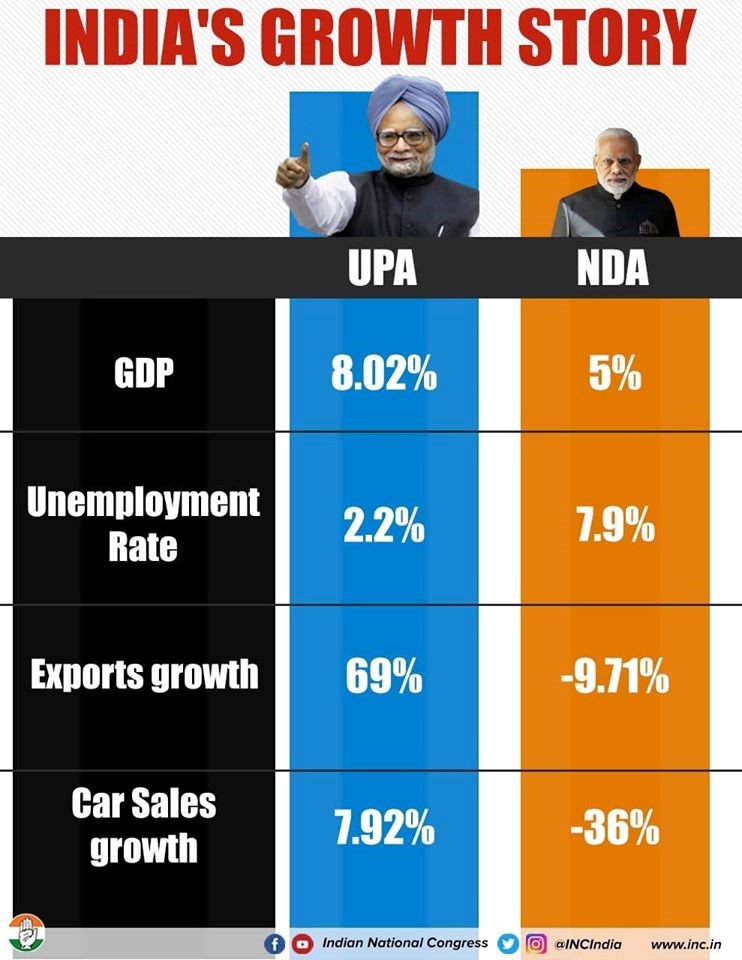
On 02 September 2019, the Indian National Congress posted an infographic comparing the GDP, Unemployment Rate, Exports Growth and Car Sales growth in India during the Manmohan Singh led UPA government’s tenure and the current NDA government led by Narendra Modi. Here is a fact check of these claims.
About Gross Domestic Product (GDP) growth rate
Claim: GDP growth rate was 8.02% during the UPA government’s tenure while it is only 5% under NDA government.
Fact: While it is true that the GDP growth rate in the first quarter of 2019-20 is just 5%, it does not convey the numbers about NDA’s complete tenure. It is also not clear whether the comparison is with respect to a particular quarter or a full financial year. Notwithstanding the controversy regarding the GDP back series data, this claim is MISLEADING.
The National Statistical Office under the Ministry of Statistics and Programme Implementation (MoSPI) on 30 August 30 2019, released the ‘Estimates of Gross Domestic Product for the first quarter’ from April to June 2019-20. As per this report, the GDP at constant (2011-12) prices in Quarter 1 of the current financial year 2019-20 witnessed a growth of only 5%. The GDP for this quarter is estimated at ₹ 35.85 lakh crores as compared to ₹ 34.14 lakh crores in the same quarter of 2018-19. The first quarter of the financial year 2018-19 had witnessed a GDP growth of 8% as compared to the first quarter of 2017-18.
The 5% growth rate in real GDP has been witnessed in the first quarter of the second NDA term. The revised GDP data released by MoSPI in August 2018, at constant (2011-12) prices, shows that during the UPA’s term, India’s real GDP growth increased from 7.9% in 2004-05 to 8.1% in 2006-07 and then declined to 3.1% in 2008-09. Again in 2010-11, it increased to 8.5% and dropped to 5.2% in 2011-12. Overall, the back series data estimates that the GDP growth during UPA (both the terms) was around 6.7%. This is contrast to the 8.1% and 7.5% growth during UPA-1 (2004-09) & UPA-2 (2009-14) respectively, using the old series data. There has also been criticism & controversy regarding the new series and the opposition termed the new data release as ‘gimmickry, jugglery, trickery and chicanery’ as per a story in The Hindu. Numerous other articles were written questioning the kind of data used and the final numbers as per the new series. At the same time, the GDP growth rate as per the new series for the first four years of the NDA (2014-18) was estimated at 7.35%. For the year 2018-19, GDP growth was estimated at 6.8%.
While it is true that the GDP growth rate in the first quarter of 2019-20 is just 5%, it does not convey the numbers about NDA’s complete tenure. It is also not clear whether the comparison is with respect to a particular quarter or a full financial year. Notwithstanding the controversy regarding the GDP back series data, this claim is Misleading.
What about Unemployment rate?
Claim: During UPA government’s tenure, the unemployment rate was 2.2% while under NDA government, the unemployment rate is 7.9%.
Fact: As per quinquennial (recurring every 5 years) NSSO surveys on employment & unemployment, the unemployment rate during the UPA was around 2.2%. The unemployment rate during the NDA as per the PLFS 2017-18 was 6.1%. The figure of 7.9% is based on the survey of a Mumbai based private organization. Hence the claim is PARTLY TRUE.
According to a Mumbai based organisation, Centre for Monitoring Indian Economy, in June 2019, the unemployment rate in India had reached 7.9%. The report has further added that the rate of labour participation has also declined. According to the report, labour participation rate is the proportion of working age population comprising of those above the age of 15 years, that is actively looking for a job, be it employed or unemployed. Unemployment rate has been calculated as the proportion of labour force that is not employed. The sample size used is 5,22, 000. The sampling method has not been mentioned.
As far as MoSPI is concerned, the quinquennial (recurring every 5 years) labour force surveys on employment and unemployment were conducted by National Sample Survey Office (NSSO). The last such survey was conducted during 2011-12. Now, NSSO has switched to the annual Periodic Labour Force Survey (PLFS) which was conducted during 2017-18.
According to the National Sample Survey Office (68th round), in 2011-12, the unemployment rate stood at 2.2%. This survey was based on 4,56,999 persons spread out across the country selected using appropriate statistical sampling methods. The Periodic Labour Force Survey (PLFS) published in May 2019 states that the unemployment rate in India as of 2017-18 was 6.1%. PLFS was based on 4,33,339 persons across the country. The unemployment rate as per earlier NSSO surveys was 2% in 2009-10 and 2.3% in 2004-05.
What about growth in Exports?
Claim: The growth of exports under UPA government’s term had increased by 69% while under the current NDA government, it shows a negative growth of 9.71%.
Fact: While it is true that the exports during UPA increased 69% in the 10 years, the numbers cited for NDA are for one particular month. During the first term of the NDA, the overall exports in USD increased by 6.4%. Hence the claim is only PARTLY TRUE.
As per a press release of the Department of Commerce in the Ministry of Commerce and Industry dated 15 July 2019, India’s exports under merchandise trade including re-exports stood at $25.01 billion in June 2019. This figure is 9.71% less than the corresponding exports in the same month in financial year 2018-19 (in June 2018, the exports stood at $27.7 billion). In terms of INR, it was observed that in June 2018 and 2019, the exports stood at ₹ 1.87 Lakh Crores and ₹1.73 Lakh Crores respectively indicating a decline by 7.52%. The cumulative value of exports in US Dollars has witnessed a negative growth of 1.69% in the last one year. It can be concluded that the decline of 9.71% is about value of exports in one particular month of June 2019.
On the other hand, in terms of INR, the total exports had increased from ₹ 16.3 lakh crores in 2008-09 to ₹ 24.6 Lakh crores in 2013-14 during the second term of UPA. In terms of US$, it was seen that during the same period, the exports increased from $189 billion in 2008-09 to $318.6 billion in 2013-14 resulting in a 69% increase in exports.
During the NDA government’s first term, the overall exports increased from $310 billion in 2014-15 to $330 billion in 2018-19, an increase of around 6.4%.
While it is true that the exports during UPA increased 69% in the 10 years, the numbers cited for NDA are for one particular month. During the first term of the NDA, the overall exports in USD increased by 6.4%. Hence the claim is only partly true.
Has the Car sales growth down 36%?
Claim: The sales of cars grew by 7.92% under UPA government’s term whereas under the current NDA government, it has fallen by 36%.
Fact: It is not clear as to what the numbers in the infographic are referring to. The decline during NDA pertain to one specific brand Maruti Suzuki in one particular month. The number mentioned for UPA could not be correlated with any of the available figures. Hence the claim remains UNVERIFIED.
With the automobile industry is struggling both globally and in India, the infographic by the Congress party has stated that the car sales have come down under the NDA government by 36%. Maruti Suzuki, a leading car manufacturer of India, in its sales report of August 2019 stated that it witnessed a decline in sale of domestic passenger vehicles by 36.1% as compared to the sales in August 2018. Further, there have been reports that the Tata Motors and Hero MotoCorp have also faced a negative growth by 45% and 20% respectively in August this year. A response in the Lok Sabha from July 2019 reveals that there has been a 10.08% decline in automobile sales in the country between January and June 2019. Data released by the Federation of Automobile Dealers Associations indicates that the sale of passenger vehicles in July 2019 decreased by 11% compared to the previous year where the sales increased by 7% compared to June 2019. So it is clear that the Congress party’s infographic is referring to data of Maruti Suzuki for the month of August 2019.
As per a research paper in International Journal of Current Research & Academic Review (IJCRAR), the sale of passenger vehicles increased from 10.61 lakh in 2004-05 to 25.03 lakh in 2013-14, during the 10 years of the UPA government. However, the sales in 2013-14 were less than the sales in both 2011-12 and 2012-13.
It is not clear as to what the numbers in the infographic are referring to, especially with respect to the UPA’s term. The decline during NDA pertain to one specific brand Maruti Suzuki in one particular month, though it has to be noted that the auto sector is going through a serious downward trend. The number mentioned for UPA could not be correlated with any of the available figures. Hence the claim remains unverified.
Did you watch our new Episode of the DECODE series on Indian Rivers?


1 Comment
Pingback: Fact Check: How true are Congress party’s claims about Exports growth, Unemployment rate and other things? - Fact Checking Tools | Factbase.us