Amidst calls for boycott & ban of imports from China, what major goods do we actually import? What has been trend like in the past few years?
Over the past few months, there have been demands from many quarters in India to ban trade with China, especially to stop using Chinese products. This sentiment has also found support from public as well.
Initially, the demand for ban was in wake of COVID-19, since China was seen as the country of origin that spread the virus and did not do enough to let the world know about the virus. In the past few weeks, the clashes at India-China border along LAC have renewed the sentiment to ban products from China.
With the death of 20 Indian soldiers in Galwan valley during a border face off, the demand for ban on Chinese products has found widespread support from public. However, there has been no change in the official stand of the Indian Government regarding trade with China, except a few minor changes on labelling etc.
But what is the value of trade with China, especially the imports? What are the products that are imported from China? How much is India reliant on China as a trading partner? In this story we take a deeper look at all these questions.
Before 2018-19, India’s highest trade value was with China
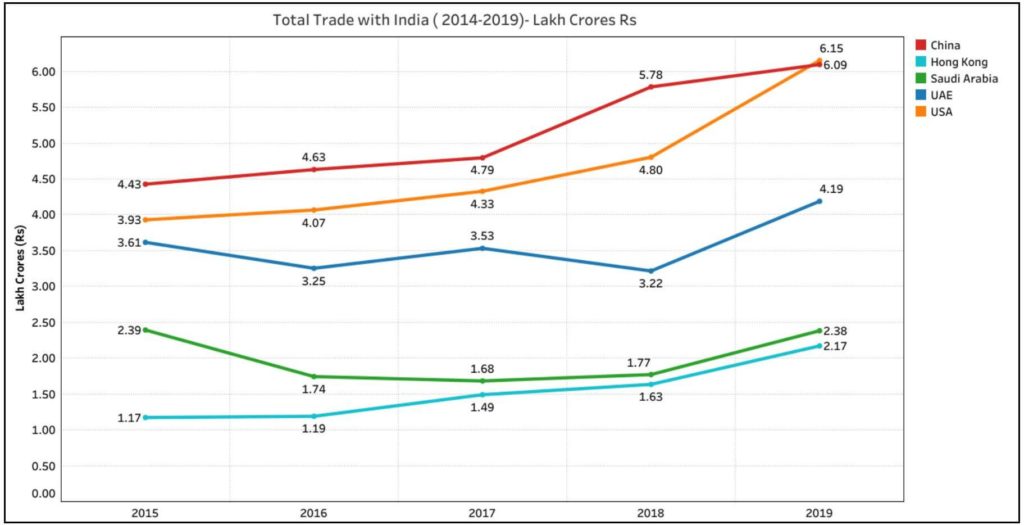
As per the data on Export-Import Data Bank of the Commerce Ministry, the USA emerged as the leading trade partner for India in 2018-19 with ₹ 6.15 lakh crores. It has managed to just overtake China, with which the value of India’s trade in that year was ₹6.09 lakh crores.
Prior to 2018-19, China was India’s leading trade partner. However, in 2018-19, value of trade with USA witnessed a significant increase, enabling it to overtake China. However, a major portion of it is due to the increase in India’s exports to USA.
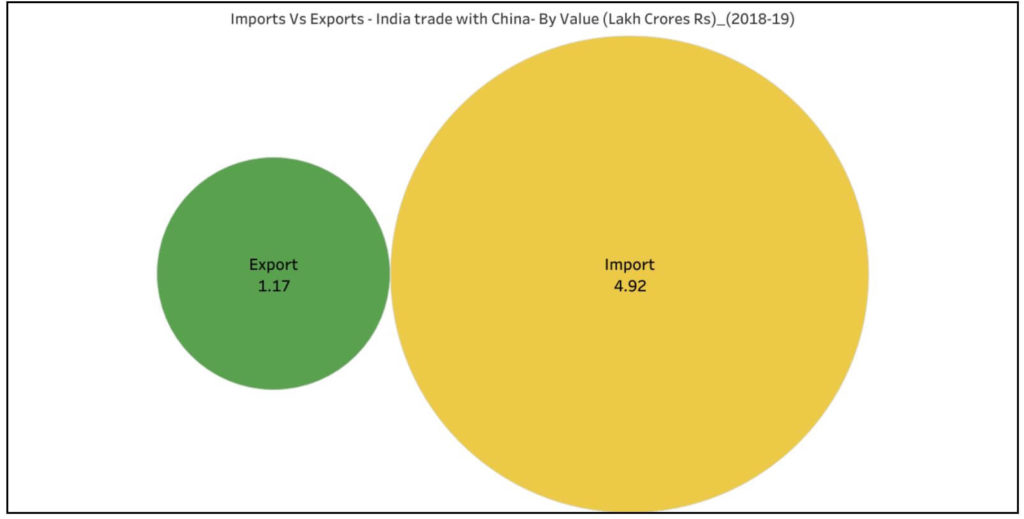
Meanwhile, China continues to dominate the Imports into India. ₹ 4.92 lakh crores of the total ₹ 6.09 lakh crores worth of trade with China in 2018-19, are Imports into India.
China’s share in India’s total imports back to 2014-15 levels
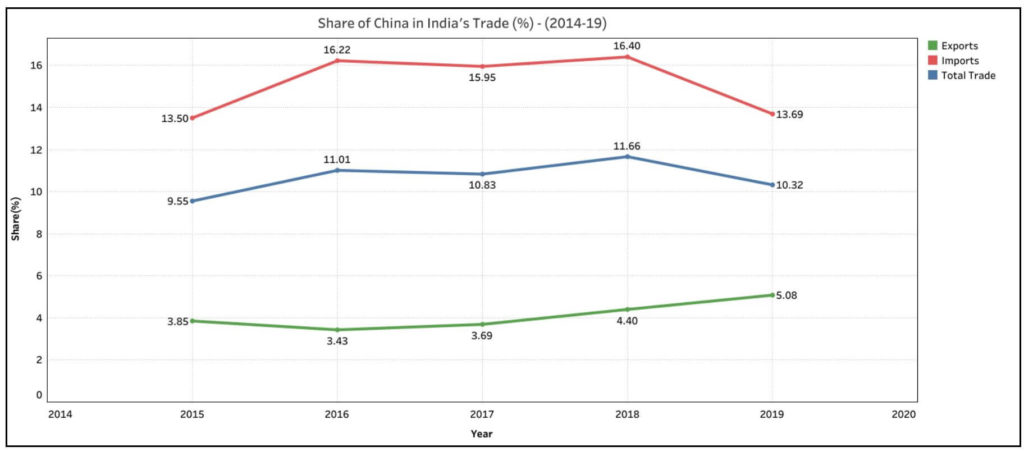
China’s share in overall trade with India is 10.32% in 2018-19. This is a slight decrease from the previous year (2017-19) when it was 11.66%. This fall in the share of total trade can be attributed to the fall in the share of imports from China.
While China continues to hold the top position in value of Imports into India, its share in total imports has fallen in 2018-19 to 13.69% from the high of 16.4% in 2017-18. The share of Chinese imports in 2018-19 are back to the 2014-15 levels when it was 13.5% of India’s total imports. In the three years between 2015-16 & 2017-18, the share of Chinese imports was greater than almost 16% and more each year.
Meanwhile, the share of exports to China in India’s total exports has increased in 2018-19. It increased to 5.08% from 4.4% in the previous year. There is a consistent increase in share of exports to China in recent years.
Slight improvement in Balance of Trade with China
In 2018-19, the total Imports from China amounted to ₹ 4.92 lakh crores, whereas the exports to China were only ₹ 1.17 Lakh crores i.e. the imports are more than 4 times more than the exports to China.
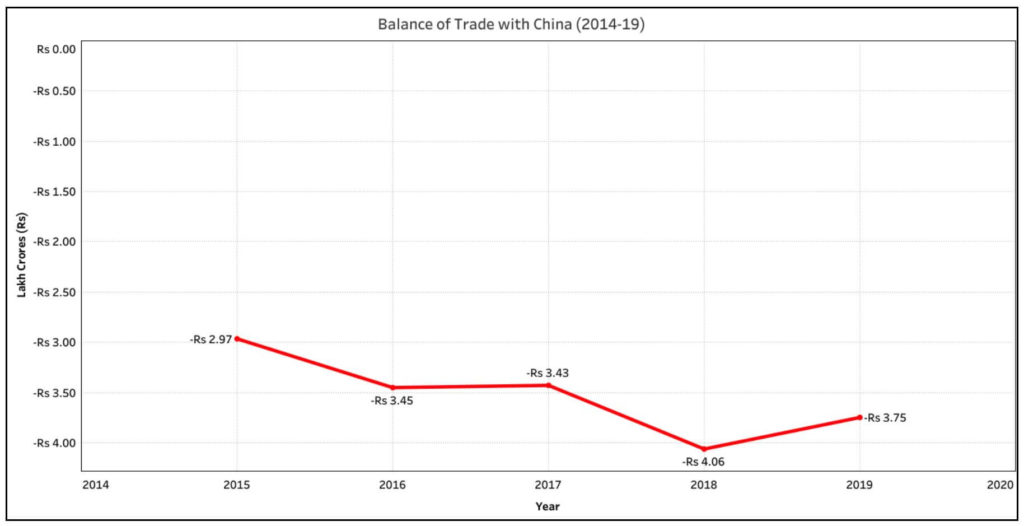
India has a deficit Balance of Trade (BoT) with China i.e. the Imports are more than the exports. The increase in exports to China and the fall in Imports in 2018-19, is reflected in the improved BoT in 2018-19, which is a trade deficit of ₹ 3.75 lakh crores. The deficit has comparatively reduced compared to the previous year when it was ₹ 4.06 lakh crores. However, the reduced deficit in 2018-19 is still higher than the deficit in each of the previous years from 2014-15 to 2016-17.
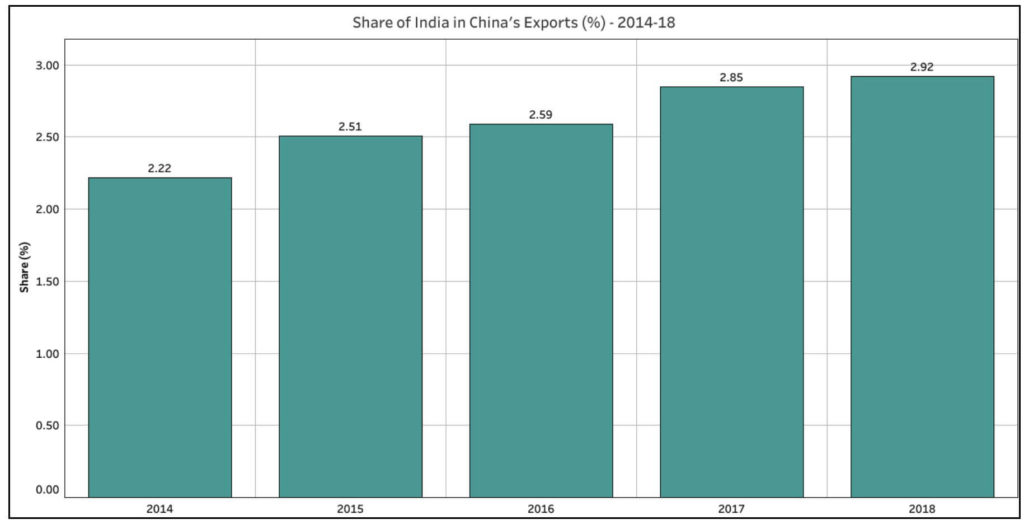
India’s share in China’s overall exports is less than 3%
While the imports from China constitute a major share of India’s total imports, the same cannot be said with respect India’s share in China’s total exports. The value of goods which China exports to India is only 2.92% of their total exports in the year 2018. Further, India ranks 7th in 2018, among the countries which have the largest share of exports from China. USA with 19.3% of the exports has a significant share while the next largest export destination is Hongkong with 10.9% of the exports.
Even though India’s share in China’s overall exports is less than 3%, this has been consistently increasing in the last few years. In 2014, India’s share was 2.22% which increased to 2.93% in 2018.
Meanwhile, share of Indian imports in China’s overall imports is very less. India ranks 15th among Asian countries with only 1.03% of China’s total imports.
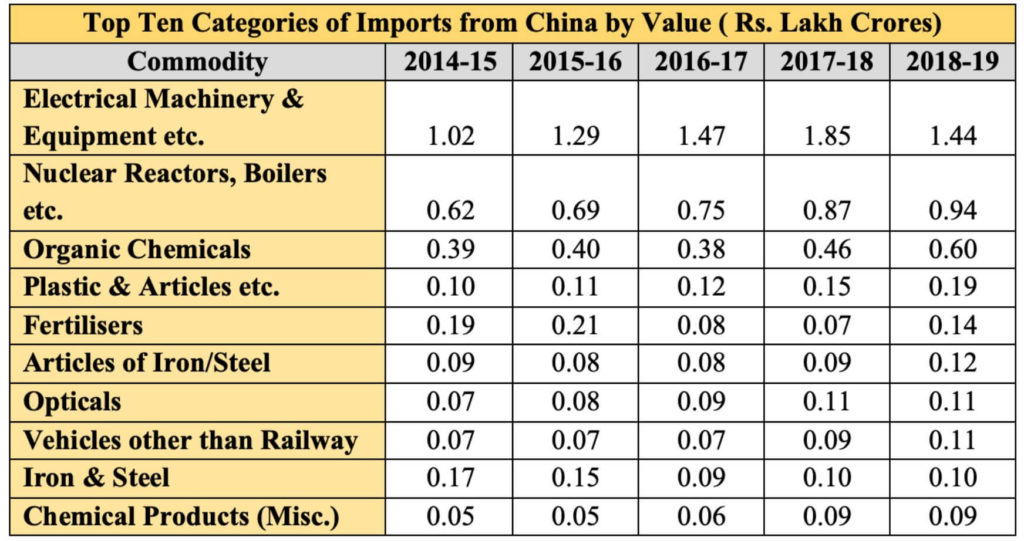
Electrical Machinery & Equipment form the major part of Imports from China
Out of the ₹ 4.92 lakh crores worth of imports from China in 2018-19, ₹ 1.44 lakh crores worth of imports is under the category ‘Electrical Machinery & Equipment’ i.e. nearly 30 %. However, the total value of imports under this category has reduced compared to previous years, when it was ₹ 1.47 & 1.83 lakh crores respectively.
Second highest category of imports by value are under ‘Nuclear Reactors, Boilers etc.’ which account for ₹ 0.94 lakh crores in 2018-19. Organic Chemicals also account for a major portion of the total imports from China. The import of Iron & Steel fell over the last five years, but there is a slight increase in import of ‘Articles of Iron and Steel’.
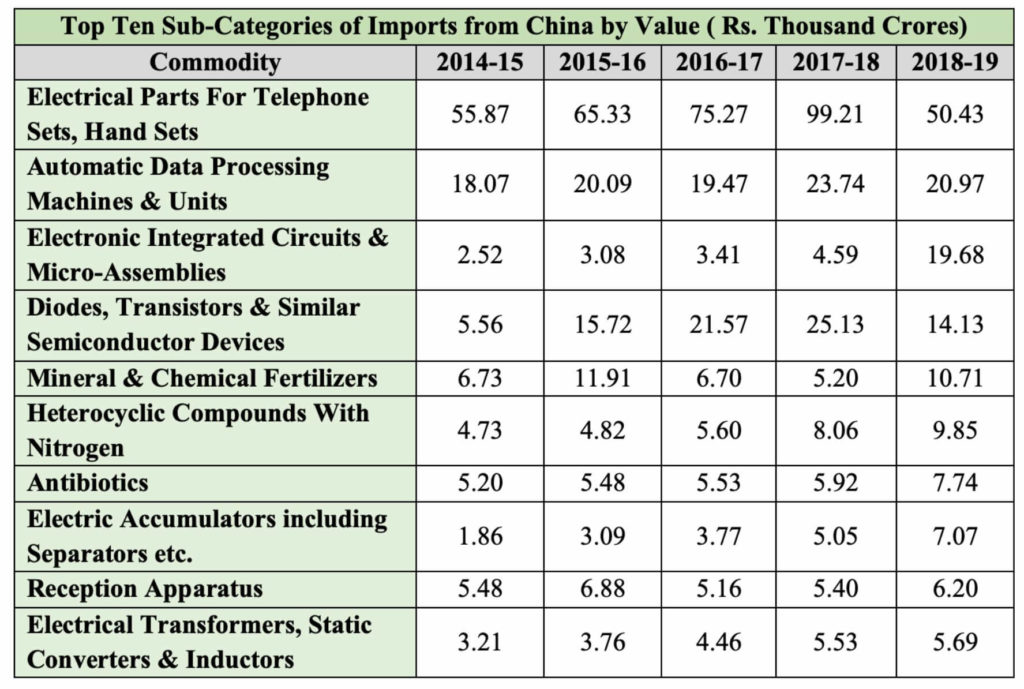
Increase in the imports of ICs, Diodes, Semi-Conductors etc.
In the category ‘Electrical Machinery and equipment’, Electrical parts for Telephone sets, Mobile handsets etc. form the major subcategory of imports. In 2018-19, these accounted for imports worth ₹ 50.43 thousand crores. However, there has been a sharp decrease compared to the previous years, where commodities imported under this head were ₹ 99.21 thousand crores in 2017-18. The imports under this head decreased for the first time in 2018-19 after a consistent increase from 2014-15 to 2017-18.
Import of Diodes, Transistors, Semi-Conductors and similar products also decreased in 2018-19. The value of imports under this head was ₹ 14.13 thousand crores in 2018-19 compared to ₹ 25.13 thousand crores in 2017-18. This trend is again similar to the trend observed in mobile handsets where the value of imports decreased in 2018-19 after a consistent increase for four years.
The import of Electronic Integrated Circuits has increased significantly in 2018-19. In 2017-8, imports under this category were worth ₹ 4.59 crores which increased nearly five times to ₹19.68 thousand crores.
Other electrical and electronic equipment are among the top 10 imported commodities. Import of Chemical fertilizers has increased from ₹ 6.73 thousand crores in 2014-15 to ₹10.71 thousand crores in 2018-19. Antibiotics also are part of the top 10 import sub-categories from China.
India is more reliant on imports from China
As the data suggests, the imports from China form not just a major share of overall imports but are critical to certain sectors A significant portion of these imports form the inputs and raw materials for various industries. Although there is fall in imports for certain commodities in 2018-19, it cannot be concluded if this is a one-off case or something that would continue. At the same time, there is increase in imports of several commodities when the data is analysed at a more granular level.
There are around 1100 subcategories of commodities imported under 96 high level import categories. Many of these commodities are integral to Indian economy. Any decision on ban of such imports from China should consider various factors like their penetration at various levels, suitable substitutes to such products or raw material either internally or other countries. Otherwise, it could be catastrophic to our economy, specially at a time when we are fighting another crisis in the form of COVID-19.
It also needs to be noted that while India is heavily reliant on imports from China, the same is not true in the case of China. Even if India bans imports of many commodities, its impact is not going to be felt by China as exports to India form a meagre share of China’s total exports.
Featured Image: Imports from China

