
As per official data, GoI’s revenue receipts stood at approximately ₹2 lakh crore in the year 2000. This figure doubled to ₹4 lakh crore by 2005, rose to ₹8 lakh crore in 2010, ₹13 lakh crore in 2015, ₹17 lakh crore in 2020, and reached ₹30 lakh crore by 2024. On the other hand, outstanding liabilities increased from ₹13 lakh crore in 2000–01 to ₹24 lakh crore in 2005–06, ₹41 lakh crore in 2010–11, ₹71 lakh crore in 2015–16, and ₹173 lakh crore in 2023–24.
India has recorded robust GDP growth over the past two decades, positioning itself among the fastest-growing major economies. According to the World Bank, India’s GDP reached $3.73 trillion in 2023, up from $2.84 trillion in 2019, reflecting a strong post-pandemic rebound. However, this impressive economic growth has been accompanied by a steady rise in public debt, both at the central and state levels. Our previous coverage has highlighted that India’s general government debt (central + states) is estimated at around 80% of GDP in 2023–24, with the central government’s share alone close to about 57%.
In this context, in the previous story, we examined the financial receipts, deficits, and liabilities of state governments based on the Reserve Bank of India’s (RBI) report on state finances. In this story, we examine these trends for the Government of India (GoI), together with the observations made in the latest RBI Annual Report for 2024-25.
The data for this story is sourced from Dataful’s collection of datasets (here & here) on Union Government accounts, curated from sources such as monthly and yearly data published by the Comptroller General of Accounts (CGA) and several RBI publications.
Between 2001 & 2024, the Fiscal Deficit has increased along with a significant increase in Total Receipts
As per the CGA data, the total receipts of the GoI are derived from two primary sources: revenue receipts and non-debt capital receipts. Revenue receipts comprise earnings from various tax and non-tax sources, while non-debt capital receipts mainly consist of recoveries of loans and other sources. In the year 2000, the GoI’s receipts stood at approximately ₹2 lakh crore. This figure doubled to ₹4 lakh crore by 2005, rose to ₹8 lakh crore in 2010, ₹13 lakh crore in 2015, ₹17 lakh crore in 2020, and reached ₹30 lakh crore by 2024.
Despite the substantial increase in receipts, the total expenditure incurred by the GoI each year from 2000 to 2024 consistently exceeded its receipts. The GoI’s expenditure is categorised into Revenue Expenditure (RE) and Capital Expenditure (CE). RE typically includes spending on wages, salaries, maintenance, repairs, etc. CE includes investments in infrastructure such as construction of irrigation projects, roads, bridges, buildings, electricity projects, etc.
According to RBI data, the total government expenditure was ₹3 lakh crore in 2000, ₹5 lakh crore in 2005, ₹11 lakh crore in 2010, ₹17 lakh crore in 2015, ₹29 lakh crore in 2020, and ₹46 lakh crore in 2024. This imbalance between income and spending resulted in persistent fiscal deficits. In 2000, the Gross Fiscal Deficit (GFD) — defined as the difference between aggregate disbursements and revenue receipts and non-debt capital receipts — was about ₹1 lakh crore, which is about 50% of the total receipts. This figure for 2005, 2010, 2015, 2020, and 2024 were 41%, 33%, 3 %, 69%, and 52%, respectively. On average, the GFD during the period from 2001 to 2024 as a share of total receipts stood at around 65%.
Expenditure-GDP Ratio Improved, but Fiscal Deficit Increased
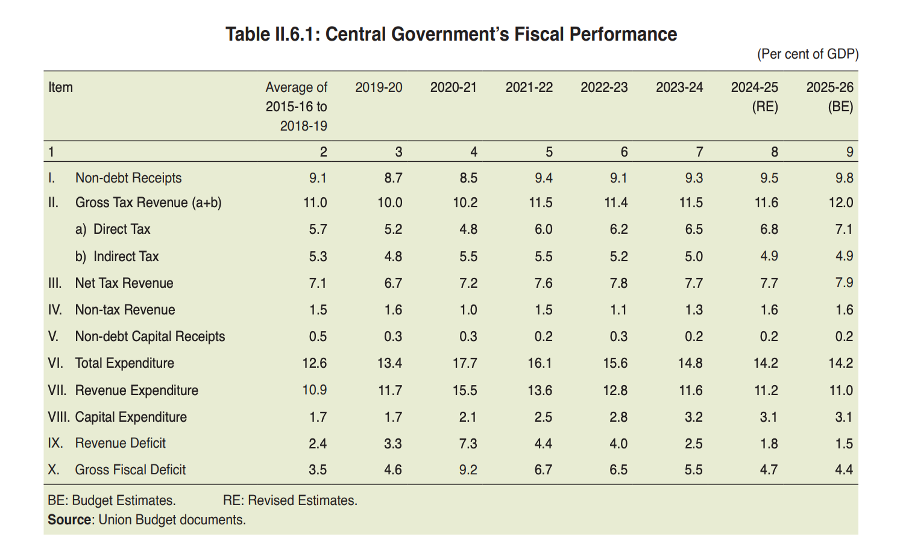
The RBI Annual Report assessed the GoI’s performance across various financial dimensions, including trends in expenditure and fiscal deficits. According to the report, during the period 2015-16 to 2018-19, the average RE and CE stood at 10.9% and 1.7% of GDP, respectively, amounting to a combined total expenditure of 12.6% of GDP.
In 2019-20 and 2020-21, the RE rose to 11.7% and 15.5% of GDP, respectively, primarily due to the impact of the COVID-19 pandemic. Since then, revenue expenditure has gradually declined, reaching 11.6% of GDP in 2023-24, which remains slightly above the 2015-16 to 2018-19 average. In contrast, capital expenditure has shown a steady upward trend, increasing from 1.7% in 2019-20 to 2.1% in 2020-21, and further to 3.2% of GDP in 2023-24.
However, the revenue deficit (RD) — defined as the difference between revenue expenditure and revenue receipts — has slightly increased, rising from an average of 2.4% of GDP during 2015-16 to 2018-19 to 2.5% in 2023-24. Similarly, the GFD has widened from an average of 3.5% of GDP in the same base period to 5.5% in 2023-24.
The improvements are in line with the RBI’s recommendation to enhance the quality of both revenue and capital expenditures.
As of 2023-24, Total Liabilities of GoI are 173 lakh crores
To meet the fiscal deficit, the GoI raises funds through various instruments such as market borrowings, which accumulate as liabilities. According to RBI data, the total outstanding liabilities of the GoI stood at ₹6 lakh crore in 1994–95. This amount steadily increased over the years — ₹13 lakh crore in 2000–01, ₹24 lakh crore in 2005–06, ₹41 lakh crore in 2010–11, ₹71 lakh crore in 2015–16, ₹124 lakh crore in 2020–21, and ₹173 lakh crore in 2023–24.
During this period, the average year-on-year (y-o-y) growth in outstanding liabilities was approximately 12%, with the highest growth of 18% recorded in the COVID-impacted year 2020–21, and the lowest of 7% in 2016–17.
As per the RBI report, the debt-to-GDP ratio of GoI, at current prices, was 60.6% in 1990–91, 58.3% in 1995–96, 60.4% in 2000–01, 57.3% in 2009–10, 51.5% in 2015–16, and 57.6% in 2023–24. These figures reflect no significant reduction in public debt over the decades, despite the Fiscal Responsibility and Budget Management Act (FRBMA) mandating that central government debt be brought down to below 40% of GDP by 2024-25.
External Liabilities Down from 23% in 1994-95 to 5% in 2023-24
In a positive development, the external liabilities of the GoI have declined from 23% of total liabilities in 1994–95 to 5% in 2023–24, indicating reduced vulnerability to exchange rate fluctuations and global interest rate movements. In 1994–95, total external liabilities stood at ₹1.4 lakh crore, accounting for 23% of total outstanding liabilities. By 2000–01, their share had declined to 15%, further to 7% in 2010–11, and consistently remained around 5% between 2016–17 and 2023–24.
Conversely, outstanding internal liabilities have increased from 77% in 1994–95 to 95% in 2023–24. Outstanding internal liabilities consist of short-term borrowings such as 91-day Treasury Bills and other instruments. Long-term borrowings primarily comprise market loans raised by the central and state governments through the issuance of government securities (G-Secs), also referred to as dated securities, in the domestic capital market. These are issued through auctions conducted by the RBI on behalf of the government.
According to the official data, the share of market loans in total outstanding liabilities was 49% in 1994–95, and it peaked at an all-time high of 82% in 2014–15 and stood at 69% in 2023–24.

