Trends in Air Quality Index (AQI) across 8 major cities of India – Ahmedabad, Bengaluru, Chennai, Delhi, Hyderabad, Kolkata, Mumbai, and Pune as reported by the CPCB indicates huge variations across major cities. Delhi, Kolkata & Ahmedabad reported poor air quality compared to other major cities if data from 2018 is considered.
Air quality in many metros of India, especially in the national capital New Delhi, is often a concern, more so in particular seasons. The winter months, including October and November, usually see a rise in pollution levels due to factors like crop burning, increased use of heating appliances, and atmospheric conditions that trap pollutants. The firecrackers burst during Diwali also adds to the situation. Recently, in Delhi, the authorities shut down the schools for more than a week due to hazardous air pollution levels in the national capital. Stage IV of the Revised Graded Response Action Plan (GRAP) is being implemented for the National Capital Region which bans the use of diesel four-wheelers that are not BS-VI compliant and restricts the entry of trucks in Delhi. Restrictions are also imposed on the functioning of industries, construction and demolition activities, mining activities, and stone crushers. The Stage of GRAP to be implemented is determined on the basis of the Air Quality Index (AQI).
In this backdrop, we look at the trends in the Air Quality Index across 8 major cities of India – Ahmedabad, Bengaluru, Chennai, Delhi, Hyderabad, Kolkata, Mumbai, and Pune. The data used in this story has been taken from Dataful. The dataset presents the data compiled every day (average of 24-hour measurements, taken at 4 PM every day) in AQI reports from the year 2015 to 12 November 2023.
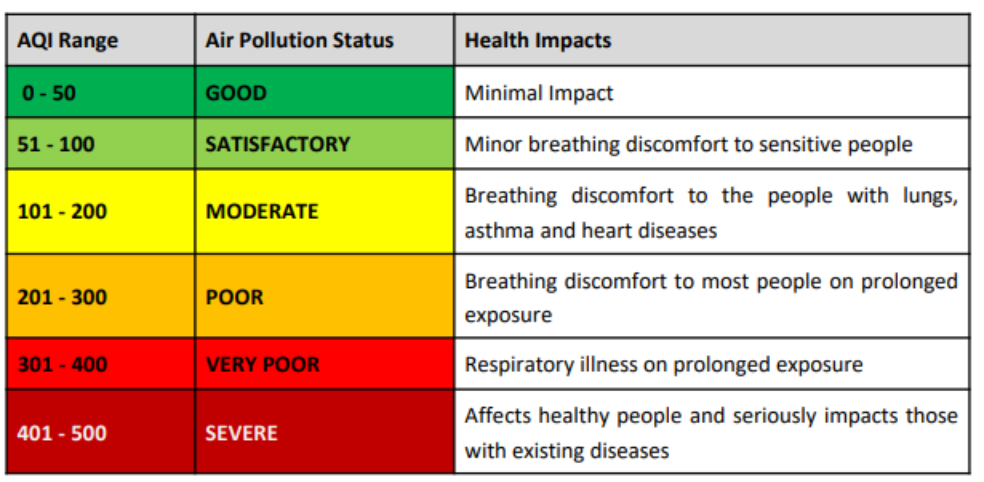
AQI categories have been determined based on likely health impacts
AQI transforms complex air quality data of various pollutants into a single number that indicates how clean or polluted the air is and mainly focuses on health. The greater the AQI value, the greater the level of air pollution and the greater the health concerns. There are six AQI categories that have been determined based on ambient concentration values of air pollutants and their likely health impacts. These are given in the following table.
AQI has not crossed 200 in Bengaluru and Hyderabad since 2017
Trends in the daily AQI reported across these 8 cities indicate that AQI is highly dependent on the season. It is seen that every year, the AQI is higher at the beginning of the year and drops gradually before increasing again towards the end of the year. That is, air quality is poorer at the beginning of the year and improves gradually, before falling again towards the end of the year, when winter sets in. This cyclic pattern is clearly visible across all the cities, except Chennai and Bengaluru where the winter temperatures don’t drop as low as in the rest of the country.
Delhi’s graph is erratic with huge variations in AQI reported each day. In the cities of Mumbai and Kolkata, there is an increased frequency in the number of days when the reported AQI crossed 200 in recent years. Meanwhile, in Bengaluru, the AQI has not crossed 200 since April 2016, and in Hyderabad since April 2017. In Mumbai, the lowest AQI reported every year has also increased slowly over the years. Pune, Chennai, Bengaluru, and Kolkata also reported a reduction in the AQI since the pandemic outbreak in April 2020. However, the AQI has increased slightly in 2023.
Air quality in Delhi has been in the ‘Good’ category only for 14 days in the last 8 years
It has to be noted that data is not available on a daily basis for all these cities. The data is available for an average of 2800 days. Based on the available data, the number of days by category of AQI has been looked at for this analysis.
In Delhi, out of the 3093 days for which data was available, the AQI has been ‘Good’ category only for 14 days and in the ‘Satisfactory’ category for 496 days. For over 1598 days, the AQI has been in the ‘Poor’, ‘Severe’, or ‘Very Poor’ category. That is, for more than 4 years of the 8 years since 2015, the AQI of Delhi was above 200.
After Delhi, Kolkata reported the greatest number of days with poor air quality. In a total of 463 days or for over a year and a quarter in the 2461 days recorded, Kolkata’s AQI crossed 200. Ahmedabad with 368 days (a little over a year), had the third-highest number of days when AQI crossed 200.
While Bengaluru never reported severe or very poor Air Quality, Hyderabad and Mumbai reported one day each as severe and very poor, out of 2800 to 3000 days for which data was available. Pune also reported one day in the severe category while Chennai reported none. However, both these cities reported days with very poor air quality. Bengaluru, Chennai, and Hyderabad recorded AQI above 200 for 15, 65, and 37 days respectively out of more than 3000 days in the last eight years.
On the other hand, Bengaluru had the greatest number of days with good air quality with 629 days (more than a year and a half). For 80% of the days, Bengaluru’s AQI was below 100- that is, either ‘Good’ or ‘Satisfactory’. Chennai also recorded 2209 out of 3027 days as ‘Good’ or ‘Satisfactory’ AQI while Kolkata, Mumbai, Pune, and Hyderabad also had ‘Good’ or ‘Satisfactory’ air quality for at least half the period. Delhi and Ahmedabad had the lowest share of days with days in these categories.
To get a better understanding of the seasonal change in the reported air quality, we look at the monthly number of days reported in each of these AQI categories.
As expected, Delhi reported very poor AQI mostly in five months- from October to December and January to February while in 9 out of the 12 months, it reported a high number of days with poor air quality. In Ahmedabad, most of the days had moderate AQI in all months except June to September when the number of days with satisfactory air quality was more. Similarly, in Bengaluru, a greater number of days with good air quality was reported in this period from June to September, around the time of monsoons. A similar trend is visible in Hyderabad and Kolkata as well while in Pune, more days reported satisfactory AQI than moderate in this period.
Multiple programmes are being implemented at the national level for monitoring and improving air quality at the national level (such as the National Air Quality Monitoring Programme (NAMP), National Clean Air Programme (NCAP), Pradhan Mantri Ujjwala Yojana (PMUY), FAME (Faster Adoption and Manufacturing of Hybrid and Electric Vehicles) India Scheme, and Smart Cities Mission). However, the data highlights the need for localized efforts to reduce air pollution, according to the season.
Featured Image: Dataful

