
The National Statistical Office conducted its first Time Use Survey in 2019. The survey measured participation in paid and unpaid activities, shedding light on the time spent on various activities. In 2024, the NSO has undertaken its second nationwide Time Use Survey, aiming to build on the insights from the previous study. Here is a review.
Understanding how people spend their time is crucial to capturing the full scope of work—both paid and unpaid—that sustains a society. Traditional data collection methods like population censuses, labour force surveys, or enterprise surveys often fail to account for unpaid work, particularly household and caregiving activities. However, Time Use Surveys (TUS) are emerging as a vital tool to bridge this gap.
TUS provides a detailed picture of how individuals allocate their time daily or weekly, offering insights into aspects of life that conventional surveys overlook. These include unpaid domestic work, caregiving, volunteer activities, and even time spent on learning, leisure, and social interactions.
Recognizing the importance of such data, the National Statistical Office (NSO) conducted its first Time Use Survey in 2019. The survey measured participation in paid and unpaid activities, shedding light on the time spent on various activities. Now, in 2024, the NSO has undertaken its second nationwide Time Use Survey, aiming to build on the insights from the previous study and provide updated data on participation rates and time spent on both paid and unpaid activities.
In today’s story, we explore the methodology and key findings of the latest Time Use Survey (TUS) and compare them with the 2019 survey to understand trends.
Methodology
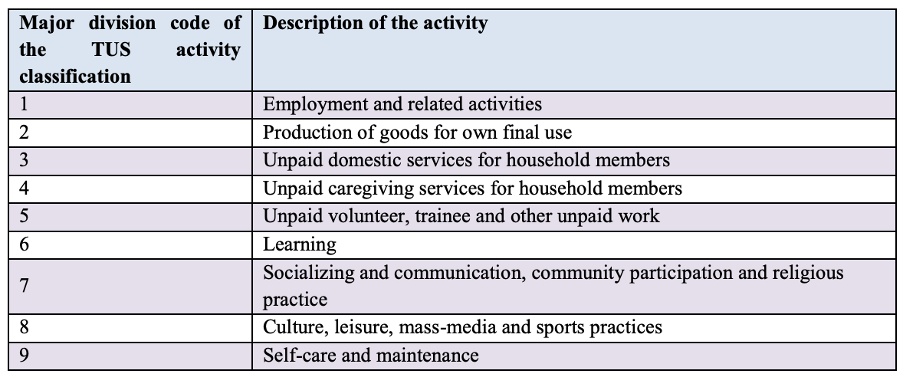
In both Time Use Surveys, respondents’ activities were categorized using the International Classification of Activities for Time Use Statistics (2016). The survey classified activities into nine major divisions, which are used to collect information on how individuals allocate their time.
Time Use Surveys classify time spent on activities in two ways: ‘average time spent per participant’ and ‘average time spent per person’.
- Average time spent per participant considers only those who took part in a specific activity. It provides an estimate of how much time, on average, participants dedicated to that activity. However, since it excludes non-participants, the total across all activities will not add up to 1,440 minutes (the full day).
- Average time spent per person includes everyone in a specific category (e.g., rural men, urban men aged 60 and above, or all individuals aged 6 and above), regardless of whether they engaged in the activity. This approach ensures that the total time distribution across different activities sums up to 1,440 minutes per person per day.
Rise in Time Spent on Employment and Related Activities in 2024 compared to 2019
A comparison of the nine major activity classifications between the 2019 and 2024 Time Use Surveys shows an increase in the average time spent per participant on employment and related activities. The time rose from 429 minutes in 2019 to 440 minutes in 2024.
For males, the average time increased from 459 minutes to 473 minutes, while for females, it rose from 333 minutes to 341 minutes. Region-wise, rural person spent more time on employment activities, with the average rising from 404 minutes to 417 minutes, while for urban persons, the time went up from 485 minutes to 490 minutes.
On a per-person basis, the average time spent in a day on employment and related activities increased from 164 to 184 minutes. On a percentage share out of the whole day, it grew from 11% to 12%. For males, it grew from 263 minutes to 287 minutes (18% to 20%), whereas for females, it rose from 61 to 71 minutes (4% to 5%).
Women spend 20% of their day on Unpaid Domestic & Care Work, while men spend just 3%
Women’s unpaid work often goes unrecognized in traditional statistics, making their contributions invisible. In fact, paid and unpaid work are not separate; they are deeply connected. When household labour is divided this way, it reinforces a hierarchy where unpaid work—mostly done by women—is undervalued.
Time Use Surveys help bring this hidden work to light, providing crucial data on the time spent on unpaid and paid activities by men and women. The 2019 and 2024 Time Use Surveys paint a clear picture of the gender divide in unpaid work. Women spend one-fifth (20%) of their day on unpaid domestic and caregiving services, while for men, it’s barely 3%—a stark contrast in how household responsibilities are shared.
Among unpaid activities, domestic services for household members take up 16% of a woman’s day in 2024, slightly down from 17% in 2019. For women, this is the second most time-consuming activity, right after self-care and maintenance. Meanwhile, for men, it barely registers—ranking among the least prioritized activities in their daily routines.
Further, in a day, the average time spent in paid and unpaid activities per person shows that women spend 305 minutes (21.2%) in unpaid work as compared to 56 minutes (3.9%) by men; while men spend 251 minutes (17.4%) in paid work as compared to 62 minutes (4.3%) by women.
More Time Spent on Leisure and Media, Less on Socializing and Self-Care
In 2024, an average Indian spent 159 minutes per day on activities related to culture, leisure, mass media, and sports, an increase from 143 minutes in 2019. Meanwhile, time spent on socializing, community participation, and religious practices slightly dropped from 130 to 125 minutes, and time dedicated to self-care and maintenance decreased from 726 to 708 minutes.
Looking at regional trends, rural areas saw an increase in leisure and media activities, rising from 135 to 151 minutes, while urban areas recorded a similar rise from 162 to 176 minutes. However, time spent on self-care and maintenance declined in both regions, dropping from 731 to 711 minutes in rural areas and from 715 to 701 minutes in urban areas. Socializing, community participation, and religious activities also saw a decline, falling from 132 to 128 minutes in rural areas and from 126 to 119 minutes in urban areas.

