The NITI Aayog recently released the National Multidimensional Poverty Index: Baseline Report 2021. The report identifies 25.01% of India’s population as multidimensionally poor. However, this estimate is significantly lower than the Priority Household beneficiaries under the National Food Security Act.
Poverty elimination lies at the core of India’s national development agenda. Reliable estimation of poverty is the first step towards eradication of poverty as a basic input for the design, implementation and monitoring of anti-poverty programmes. India has undertaken periodic assessments of the incidence of poverty since the 1960s. The erstwhile Planning Commission released the estimates of poverty as the number of persons below the poverty line (BPL) as a percentage of the Indian population for the years 1973-74 to 2011-12.
For 2011-12, based on the Tendulkar poverty line, Planning Commission released poverty data, where the number of poor in the country was pegged at 269.8 million or 21.9% of the population, as against 29.8% in 2009-10. The Tendulkar Expert Group validated the poverty lines by checking the adequacy of actual private consumption expenditure per capita near the poverty line on food, education, and health, resulting in the figure of Rs. 32 and Rs. 26 a day for urban and rural areas. However, this estimation faced widespread criticism and the Rangarajan Committee was formed in 2012, which recommended raising the daily per capita expenditure to Rs. 47 and Rs. 32 in urban and rural areas, respectively, at 2010-11 prices. The government did not take a final call on the report of the Rangarajan Committee. After 2010-211, no official poverty estimates in India were released.
As shortcomings of poverty measurements based on consumption by various Committees became apparent, the poverty line approach was abandoned by the NITI Aayog, which replaced the Planning Commission on 1 January 2015. The multi-dimensional character of poverty was recognized. In the above content, the NITI Aayog recently released the National Multidimensional Poverty Index: Baseline Report 2021.
25% of Indians multidimensionally poor
The Multidimensional Poverty Index (MPI) is based on three dimensions — health, education, and standard of living — with each having a weightage of one-third in the index. These dimensions are further based on 12 segments — nutrition, child and adolescent mortality, antenatal care, years of schooling, school attendance, cooking fuel, sanitation, drinking water, electricity, housing, assets, and bank accounts.
This baseline report of India’s first-ever national MPI measure is based on the reference period of 2015-16 of the National Family Health Survey (NFHS) i.e., NFHS 4th round. India has made remarkable strides through flagship programmatic interventions in housing, electricity, sanitation, drinking water, and cooking fuel, among others, as reflected in initial publications of NFHS 5th round (2019-20). Since the NFHS dataset is not available for all indicators and states, the baseline report and MPI index estimation is presently based on NFHS-4 and it will be updated once the complete NFHS-5 dataset is available.
The MPI (multidimensional poverty index) report identifies 25.01% of India’s population as multidimensionally poor. About 32.75% of the population in rural areas and 8.81% of the population in urban areas have been identified as multidimensionally poor, as per the MPI 2021 Report.
Among Indian states, Bihar records the highest headcount poverty ratio with 51.91% of the population who are multidimensionally poor. This is followed by Jharkhand (42.16%), Uttar Pradesh (37.79%), Madhya Pradesh (36.65%), Meghalaya (32.67%) and so on.
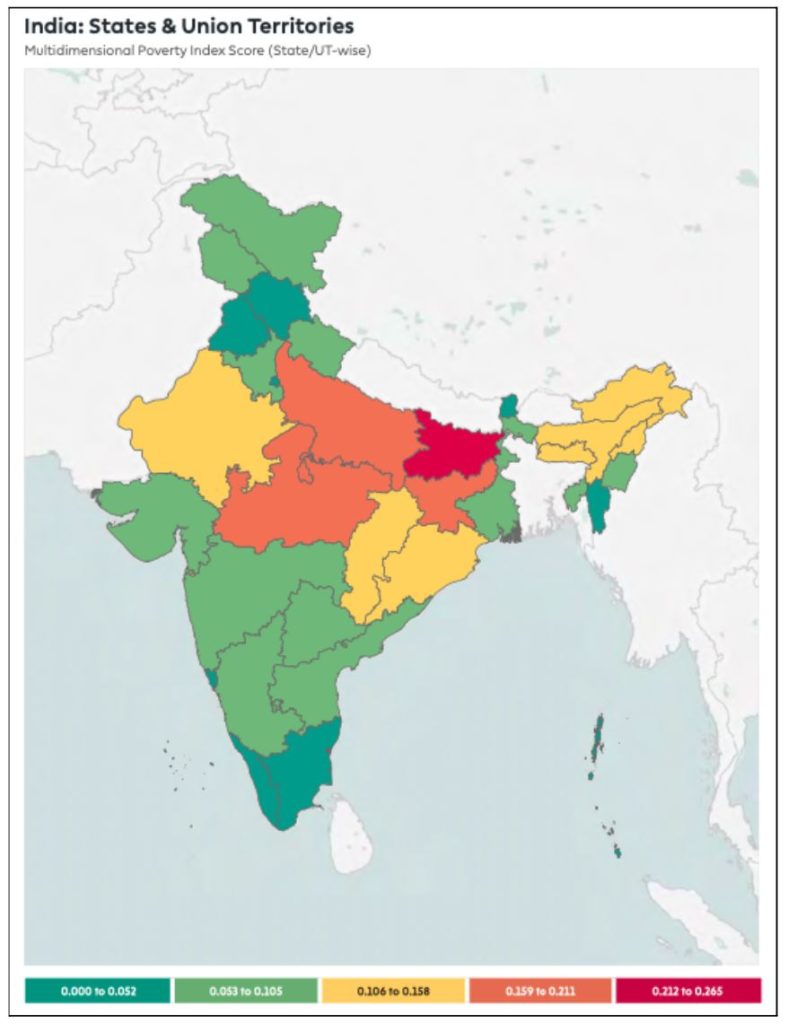
The lowest headcount poverty ratio among the Indian States has been recorded for Kerala at 0.71%. In other words, less than 1% of Kerala’s population is multidimensionally poor as per the MPI. Other states that recorded a low share of the population as multidimensionally poor are Goa (3.76%), Sikkim (3.82%), Tamil Nadu (4.89%), Punjab (5.59%), Himachal Pradesh (7.62%), and so on.
More than half the Indians are deprived of clean cooking fuel & adequate sanitation facilities
The highest proportion of the population is deprived in the cooking fuel and sanitation categories at 58.5% and 52%, respectively. In other words, more than half of India’s population does not have access to clean cooking fuels/technology and appropriate sanitation facilities.
Housing is the third most common deprivation category, wherein 45.6% of the population has inadequate housing (the floor is made of natural materials, or the roof or wall is made of rudimentary materials).
This is followed by nutrition (37.6%), maternal health (22.6%), drinking water (14.6%), assets (14%), years of schooling (13.9%), electricity (12.2%), bank account (9.7%), school attendance (6.4%) and child and adolescent mortality (2.7%).
Bihar, Jharkhand, Odisha are most deprived of cooking fuel, while Arunachal Pradesh, Assam, Tripura most deprived in housing, as per the MPI report
In the MPI report, under the cooking fuel deprivation category, a household is deprived if the primary source of cooking fuel is dung, agricultural crops, shrubs, wood, charcoal, or coal.
In Bihar, about 82.9% of the population does not have access to clean cooking fuel, followed by Jharkhand (82.14%), Odisha (80.94%), Chhattisgarh (80.94%), Assam (77.12%) and so on. The states with the least deprived proportion of the population in the cooking gas category are Goa (14.91%), Tamil Nadu (24.07%), Telangana (31.66%), Mizoram (32.18%) and others.
According to the NFHS-5 results, (not included in the present MPI estimation), significant progress is witnessed in terms of improved access to clean cooking fuel amongst all states. In Bihar, the percentage of population deprived of cooking fuel stands at 63.2% in 2019-20, as compared to 83% in 2015-16. In Jharkhand, the deprivation changes from 82% to 68%, in Assam 77% to 60.5%, in Karnataka 45.5% to 21.9%, and so on between NFHS 4 & 5.
However, these improved results are not represented in the present national MPI. The next round of MPI estimations soon will consider the improved values of developmental indicators, as evident in the NFHS-5 (2019-20) dataset.
Arunachal Pradesh, Assam, Tripura most deprived in housing, as per MPI report
In the MPI report, under the housing deprivation category, a household is deprived if the household has inadequate housing: the floor is made of natural materials, or the roof or wall is made of rudimentary materials.
In Manipur, about 81.49% of the population are deprived in the housing category, followed by Arunachal Pradesh (76.15%), Assam (75.90%), Tripura (74.66%), Bihar (73.73%), and so on. The states with the least deprived proportion of the population in the cooking gas category are Kerala (10.76%), Goa (16.16%), Andhra Pradesh (17.55%), Punjab (19.30%), and so on.
According to NFHS-5 results (for a limited number of states), improvements in housing can be observed for several states. For instance, in Manipur, the proportion of the population deprived of adequate housing stands at 76.8% in 2019-20, as compared to 81.5% in 2015-16. In Assam, the deprivation changes from 75.9% to 69.3%, in Bihar 73.7% to 67%, in Nagaland 71% to 66.4%, and so on between NFHS-4 & NFHS-5.
The burden of malnutrition is highest in Bihar at 52%, followed by Jharkhand, MP, UP
While the report covers a total of 12 indicators, we focus on nutrition and look at the state-wise trends in nutrition deprivation. In the MPI report, under the nutrition deprivation category, a household is deprived if any child between the ages of 0 to 59 months, or woman between the ages of 15 to 49 years, or man between the ages of 15 to 54 years -for whom nutritional information is available – is found to be undernourished.
In Bihar, about 51.88% of the population is deprived in the nutrition category, followed by Jharkhand (47.99%), Madhya Pradesh (45.49%), Uttar Pradesh (44.47%), Chhattisgarh (43.02%), and so on. The states with the least deprived proportion of the population in the nutrition category are Sikkim (13.32%), Kerala (15.29%), Arunachal Pradesh (21.04%), Mizoram (21.37%), and so on.
While NFHS-5 (2019-20) estimates from Phase I & II present new estimations on nutrition, the present MPI calculation is based on nutrition estimations from NFHS-4 (2015-16). One of our earlier stories highlight and deep dives into the changes in certain states’ nutritional status from Phase – of NFHS-5.
NFSA coverage represents high levels of food vulnerability across the country
In terms of nutrition parameters, apart from NFHS rounds, the National Food Security Scheme 2013 (NFSA) also estimates the proportion of vulnerable households vis-à-vis food and nutrition security. To alleviate poverty, NFSA claims the right to receive food-grains at subsidized prices by persons belonging to eligible households, that is Priority House Holds (PHH) under Targeted Public Distribution System (TPDS).
Prior to implementing NFSA, there were mainly three types of ration cards issued by State Governments such as APL (above poverty line), BPL (below poverty line) and AAY (Antyodaya, meaning poorest of the poor) distinguished by different colours. According to NFSA 2013, the households have been re-classified into two categories: Non-Priority and Priority. Eligibility in the PHH category is determined by respective state governments and has been divided into 4 sub-categories:
- General Priority
- AAY (Antyodaya Anna Yojana) ration card
- AY (Annapurna Yojana) ration card
- State Priority Ration Card
- Social Security (SS) that comes under State priority
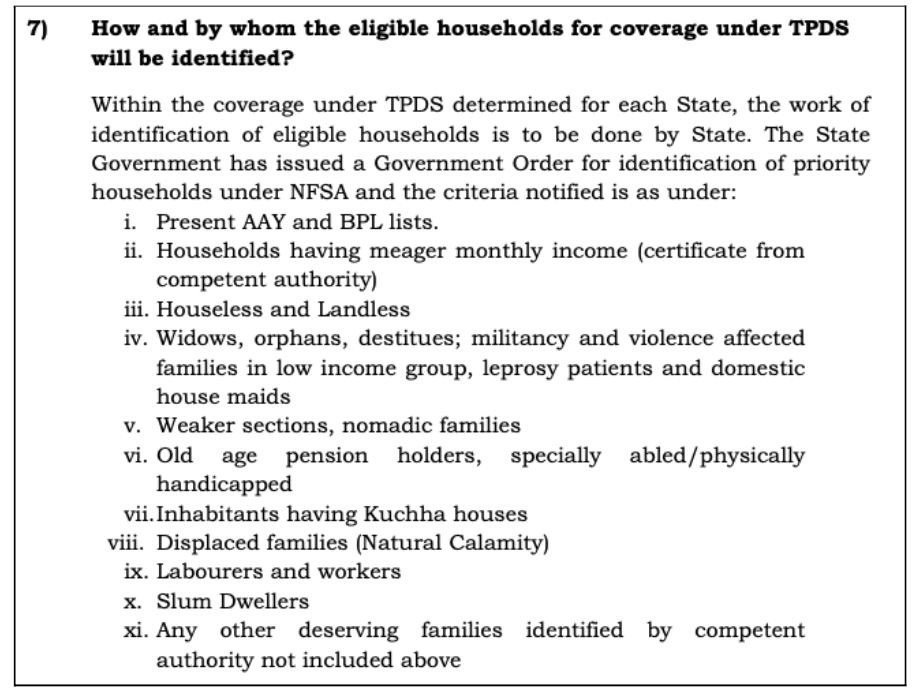
The Priority household (PHH) represents the most vulnerable sections in the society vis-à-vis food and nutrition security. One such State example of determining PHH/ Priority households under NFSA is given below. Thus, the NFSA prioritizes household needs considering not only their income but other socioeconomic imbalances in the society.
At present, NFSA covers up to 75% of the rural population and 50% of the urban population in the country. Based on this, state-wise coverage under NFSA was determined by the erstwhile Planning Commission—now NITI Aayog—by using the National Sample Survey of Household Consumption Expenditure Survey data for 2011-12. Since then, the state-wise coverage ratio has not been revised.
At an all-India level, about 59.02% of population (in terms of the number of persons) is categorised under the Priority Household category. It has to be noted that NFSA statistics provide coverage in terms of the proportion of households as well as persons/population. Here, we have used the latter to contrast the NFSA coverage with MPI indicators.
Among Indian states, Manipur has the highest proportion of the population under Priority households at 83.26%, followed by Bihar at 71.88%, Assam at 71.21%, Chhattisgarh at 70.61%, Jharkhand at 68.47%, and so on.
In other words, the proportion of the population recognised as vulnerable vis-à-vis food and nutrition security under NFSA as priority households are 59.02% at an all-India level. Almost half of all Indian states have more than 50% of their population under the priority household category. The extend of food insecurity represented by NFSA coverage (under PHH households) paints a rather grim picture.
Priority Households under NFSA & MPI are two different Metrics
It is important to reiterate that NFSA statistics and MPI are two different metrics, with distinct purposes and methodologies. Therefore, no comparisons can be drawn between the two indicators plainly. However, we can note that extend of food and nutrition vulnerability indicated by NFSA coverage (under priority households, in terms of the number of persons) is considerably higher, than the proportion of population identified as multidimensionally poor by the MPI.
This demonstrates one way in which poverty estimations often fall in grey areas. Measuring poverty has evolved globally over the years. From conventional methods where minimum income (or expenditure) was estimated to MPI index calculated by setting deprivation cut-offs, this example demonstrates the challenges in capturing the depths and severity of various dimensions of poverty.
Featured Image: Multidimensional Poverty estimates Report of the NITI Aayog

