While various modes of online money transfers & digital payments have witnessed exponential growth in the last decade or so, the average transaction value has fallen for NEFT & RTGS transactions. Compared to the high in 2018, the average transaction value of NEFT & RTGS fell by more than 25%.
Banking and payment systems are vital for the functioning of a nation’s economy. The efficiency with which these systems perform their expected tasks determines their operative capabilities and level of adoption. Further, these systems must cater to the different needs of consumers. Accordingly, governments adopt various mechanisms to fulfil the objectives of both the consumers as well as the banking system. Multiple digital payment systems have been introduced in India over the years. We look at the various types of fund transfer mechanisms in India and their trends in terms of transaction volume & value.
Fund transfer (payment systems) ecosystem in India
Emerging technologies have caused disruptions across various sectors. The financial sector and particularly, money transfer is one area where such disruption is evident. Transfer of money through digital modes brings with it a number of challenges in terms of security, transfer limits, processing durations and cost of money transfer. It becomes complex to accommodate all these into a single system. Hence, central banks devise multiple mechanisms to cater to the different needs of consumers.
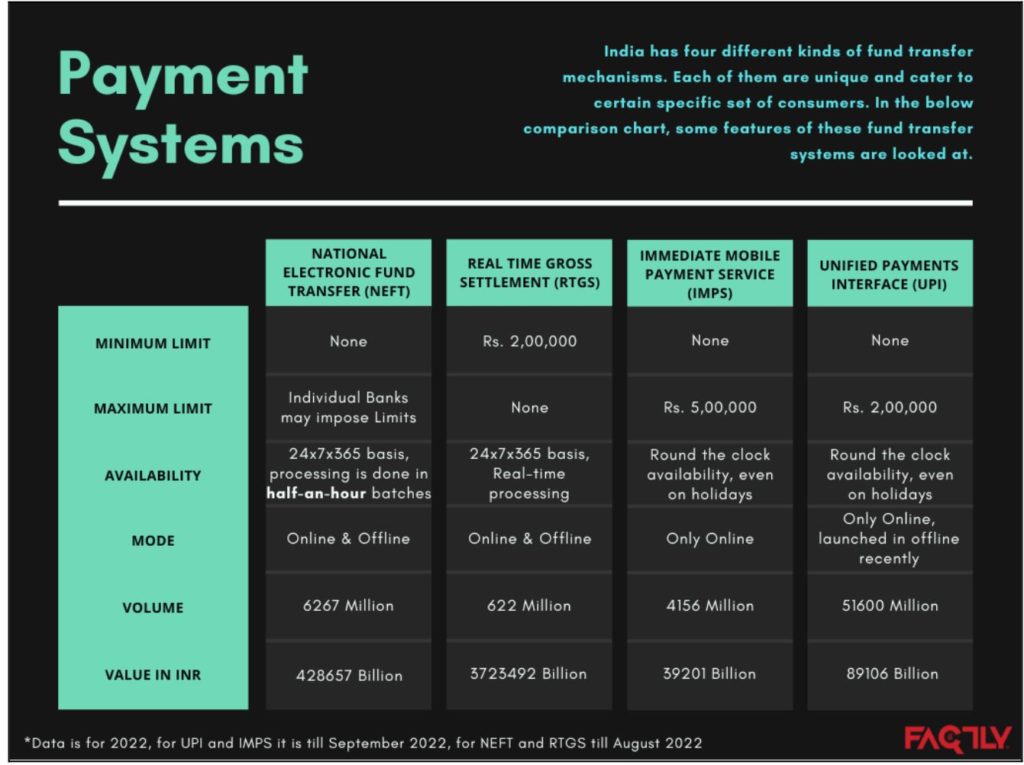
In India, there are four broad types of fund transfer mechanisms, with unique features. Below is the gist of these four.

IMPS and UPI transfers are on an exponential rise
The data from 2012 clearly indicates the changing patterns of the fund transfer mechanisms. Some clear patterns emerge when looking at such data.
- The value of transfers processed through Credit Cards gradually is rising, barring 2020. This could be due to the growth in ‘Buy now Pay Later’ (BNPL) schemes.
- Payments through debit cards are also growing incrementally, with 2013 and 2018 seeing big leaps from their previous year.
- IMPS payments are rising exponentially, with 2021 seeing a big jump in value.
- Payments through NEFT and RTGS show an incremental increase. NEFT performed better even during the pandemic-affected year of 2020.
- The growth in UPI payments surpasses other modes. The year 2021 saw almost 110% growth in the value of transfers as compared to 2020. This could be attributed to the rise in digital transactions owing to the pandemic.
The trend is similar to the volume of transactions through different payment modes.
Average size of transactions through NEFT and RTGS is declining
While the volume and value of transactions offer a fair idea of the dynamics of different payment mechanisms, the average size of the transaction provides a clearer picture of the utility of the payment systems. This is obtained by dividing the total value of the transaction by the total volume of transactions. Data indicates that the average size of transactions for credit cards and debit cards has gone up in 2021, while IMPS and UPI are maintaining steady growth. However, the average transaction size for NEFT and RTGS has been declining for the past couple of years.
Positive, but a declining growth rate of value of transactions
On plotting the respective growth trends for each of these transfer modes, it is observed that:
- A credit card registered increasing growth from 2013 to 2017, from when it started declining. In 2020, it registered the worst growth rate of -14%, but in 2021, it bounced back.
- For debit cards, the growth has always been less than 20%, with 2020 witnessing a negative growth. The growth for 2022 as of September doesn’t look promising.
- The IMPS growth rate had been declining from 2014 to 2022, barring an increase in 2021.
- NEFT and RTGS have been registering lower growth rates since 2017.
- As expected, the growth rate for UPI has also been slower as compared to its initial launch years.
While all the payment modes more or less registered positive growth, the quantum of such growth is declining. Also, one must be careful in looking at the growth rate for 2021 as many payment modes registered reduced values in 2020 due to the pandemic. Any increase/decrease for 2021 must be evaluated keeping 2020 in mind.
Average transaction size growth rate
While it is important to look at the cumulative growth rates, it is equally important to focus on the average ticket/transaction size. This trend would tell us whether volume or value is the driving factor behind growth in cumulative value. On analysing the trend of growth in average ticket size, it is observed that,
- Credit Cards have registered the best figures in 2021 and 2022, growing at double-digit.
- Debit card average transaction size growth rose to its highest in 2020, the pandemic year. The current growth in average transaction size is better than its previous trend.
- The growth in average transaction size for IMPS has been declining from 2016 to 2021. However, figures for 2022 show positive growth.
- RTGS and NEFT registered a consistent negative growth of average transaction size from 2019 till date.
- The average transaction size growth for UPI is also falling consistently, with 2021 registering an increase of only 3%, as compared to 9% in 2019.
Featured Image: Banking and payment systems


