As India crosses 15000 confirmed cases of COVID-19, the scenario at the state-level is not uniform. Here is a snapshot of the numbers at the state-level and how the numbers vary.
As the country continues to fight COVID-19, here is a detailed analysis of state-wide numbers related to various aspects of the pandemic.
The latest number of confirmed cases, recovered/cured patients and deaths reported across states have been listed below. The data has been taken from Ministry of Health & Family Welfare (as on 17 April 2020).
Name of State / UT | Total Confirmed cases (Including 76 foreignNationals) | Cured/Discharged/ | Death |
Andaman and Nicobar Islands | 12 | 11 | 0 |
Andhra Pradesh | 572 | 36 | 14 |
Arunachal Pradesh | 1 | 0 | 0 |
Assam | 35 | 5 | 1 |
Bihar | 83 | 37 | 2 |
Chandigarh | 21 | 9 | 0 |
Chhattisgarh | 36 | 24 | 0 |
Delhi | 1707 | 72 | 42 |
Goa | 7 | 6 | 0 |
Gujarat | 1099 | 86 | 41 |
Haryana | 225 | 43 | 3 |
Himachal Pradesh | 36 | 16 | 1 |
Jammu and Kashmir | 328 | 42 | 5 |
Jharkhand | 33 | 0 | 2 |
Karnataka | 359 | 89 | 13 |
Kerala | 396 | 255 | 3 |
Ladakh | 18 | 14 | 0 |
Madhya Pradesh | 1310 | 69 | 69 |
Maharashtra | 3323 | 331 | 201 |
Manipur | 2 | 1 | 0 |
Meghalaya | 9 | 0 | 1 |
Mizoram | 1 | 0 | 0 |
Nagaland | 0 | 0 | 0 |
Odisha | 60 | 19 | 1 |
Puducherry | 7 | 1 | 0 |
Punjab | 202 | 27 | 13 |
Rajasthan | 1229 | 183 | 11 |
Tamil Nadu | 1323 | 283 | 15 |
Telangana | 766 | 186 | 18 |
Tripura | 2 | 1 | 0 |
Uttarakhand | 40 | 9 | 0 |
Uttar Pradesh | 849 | 82 | 14 |
West Bengal | 287 | 55 | 10 |
India | 14378 | 1992 | 480 |
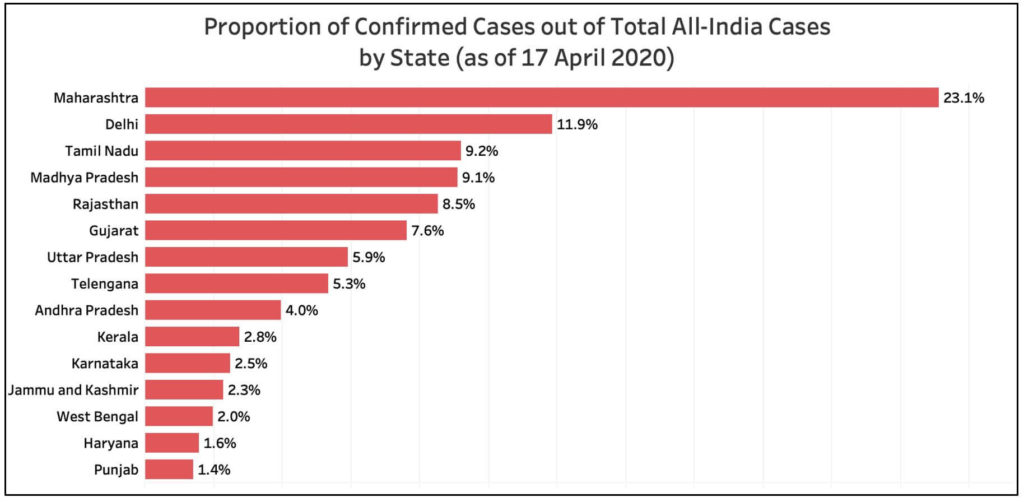
Let’s take a look at how much each state/UT account for in the nation-wide picture of COVID-19 cases.

Maharashtra accounts for the most number of confirmed cases (about 23%) in India. The four states of Maharashtra (23.1%), Delhi (11.9%), Tamil Nadu (9.2%), and Madhya Pradesh (9.1%) together account for more than 50% of the total confirmed cases across India as of 17 April 2020.
Cured & Deaths – Picture of the States
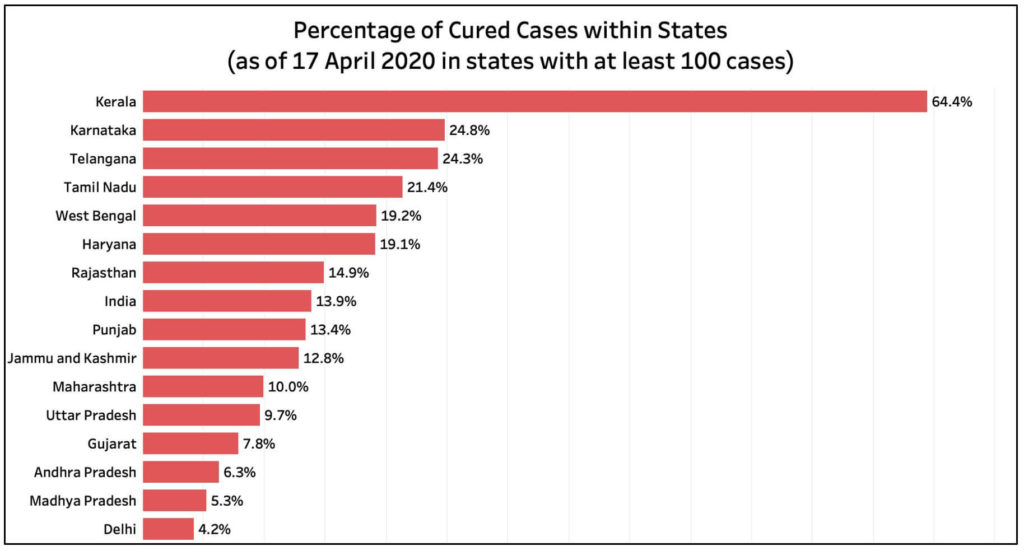
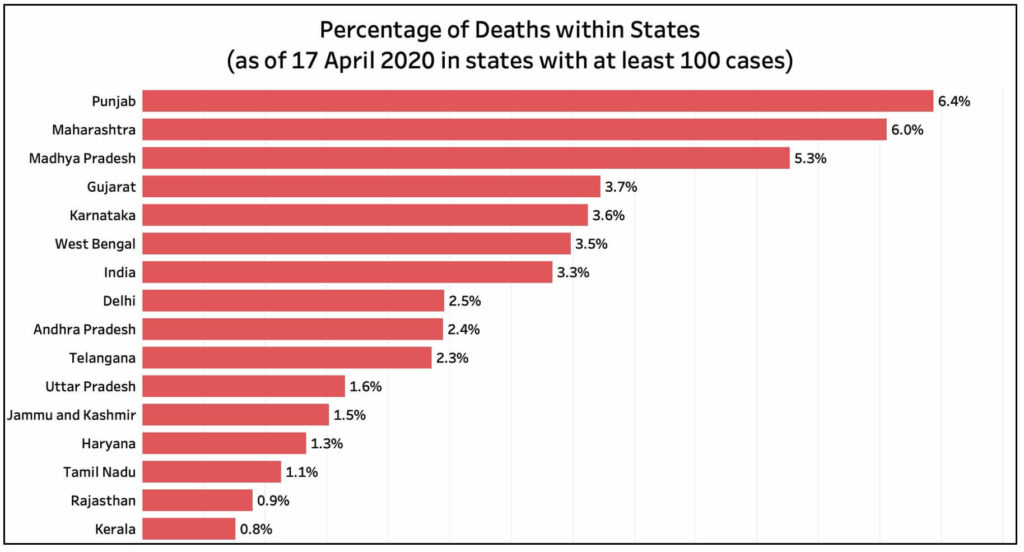
Let’s take a look at how states have fared in terms of cured cases and deaths.

The All-India average of cured cases is around 14%. Andaman & Nicobar Islands stands highest with 91.67% cured cases though there are only 14 confirmed cases here. In Goa, 6 of the 7 confirmed cases are discharged (85.71%). About seven states have cured around 50% or more confirmed cases within their territories: Ladakh (77.8%), Chhattisgarh (66.7%) and Kerala (64.4%), Tripura (50%), and Manipur (50%). Since these numbers only indicate the percentage of cured cases within states and are not defined by the magnitude of cases in a state, the numbers do not represent the performance of states in terms of actual numbers.
Of the states that have reported at least 100 cases, the recovery rate is highest in Kerala by a distance. More than 20% of the cases are cured in the states of Karnataka, Telangana & Tamil Nadu. Delhi which has reported more than 1800 cases, the second-highest in the country, has the least recovery rate of only around 4.2%.

The All-India percentage of deaths is 3.3%. In terms of the states, Meghalaya reported 11.1% deaths, followed by Punjab (6.4%), Jharkhand (6%), Maharashtra (6%), and Madhya Pradesh (5.3%). Since Meghalaya & Jharkhand reported fewer cases, their death percentages are on a higher side. Of the states which reported more than 100 confirmed cases, Punjab reported a greater proportion of deaths (6.4%). Kerala which has the highest percentage of cured cases also reported the lowest percentage of deaths of these states.
What about testing?
Most states have been reporting the number of samples they have tested so far. Sates like Telangana, Arunachal Pradesh, Manipur, Meghalaya, and some Union Territories are not regularly publishing data in this regard. The data is sourced from state health bulletins to the last updated versions (as on 17 April 2020) and the total number of tests for India has been sourced from Indian Council of Medical Research (ICMR) (as on 17 April 2020).
Name of State / UT | Samples Tested | Number of Confirmed Cases | Confirmed Percentage |
Andhra Pradesh | 20,235 | 572 | 2.83% |
Arunachal Pradesh | 206 | 1 | 0.49% |
Assam | 4,236 | 35 | 0.83% |
Bihar | 9,486 | 83 | 0.87% |
Chandigarh | 358 | 21 | 5.87% |
Chhattisgarh | 5,519 | 36 | 0.65% |
Delhi | 21,409 | 1707 | 7.97% |
Goa | 673 | 7 | 1.04% |
Gujarat | 23,483 | 1099 | 4.68% |
Haryana | 8,884 | 225 | 2.53% |
Himachal Pradesh | 1,992 | 36 | 1.81% |
Jammu and Kashmir | 6,438 | 328 | 5.09% |
Jharkhand | 3,751 | 33 | 0.88% |
Karnataka | 17,594 | 359 | 2.04% |
Kerala | 18,029 | 396 | 2.20% |
Ladakh | 917 | 18 | 1.96% |
Madhya Pradesh | 20,298 | 1310 | 6.45% |
Maharashtra | 55,678 | 3323 | 5.97% |
Meghalaya | 617 | 9 | 1.46% |
Mizoram | 94 | 1 | 1.06% |
Nagaland | 184 | 0 | 0.00% |
Odisha | 7,577 | 60 | 0.79% |
Punjab | 5,988 | 202 | 3.37% |
Rajasthan | 42,847 | 1229 | 2.87% |
Tamil Nadu | 29,673 | 1323 | 4.46% |
Tripura | 726 | 2 | 0.28% |
Uttarakhand | 2,831 | 40 | 1.41% |
Uttar Pradesh | 24,643 | 849 | 3.45% |
West Bengal | 4,212 | 287 | 6.81% |
The data suggests that states that have tested a greater number of samples have reported higher confirmed cases. Since all the states have not reported their testing numbers, this juxtaposition is limited to the ones that have reported their testing numbers.


