Financial Inclusion is the latest buzzword, thanks to the ‘Prime Minister Jan Dhan Yojana (PMJDY)’. This is a national scheme for Financial Inclusion launched by the BJP led NDA (National Democratic Alliance) government at the center in 2014. The scheme was announced on the Independence Day of 2014.
[orc]Since then, NDA leaders have been talking about this scheme as a game changer in financial inclusion on a scale that the country has never seen. The number of accounts opened as part of PMJDY also made it to Guinness records for most number of accounts opened in a week. As on 04th April, a total of 12.54 crore bank accounts were opened as part of this scheme.
The Congress leaders have also been vocal in hitting back at the government by saying that the financial inclusion scheme during the UPA (United Progressive Alliance) regime did equally well and it was the previous NDA regime that did very poorly in this aspect. We decided to dig out the numbers for both NDA- 1 (from 1998 to 2004) and for UPA (2004-2014). Reserve Bank of India (RBI) has numbers only up to 2013. Hence the numbers presented in this article are only up to 2013.
Number of Deposit Accounts & Credit Accounts opened in Scheduled Commercial Banks
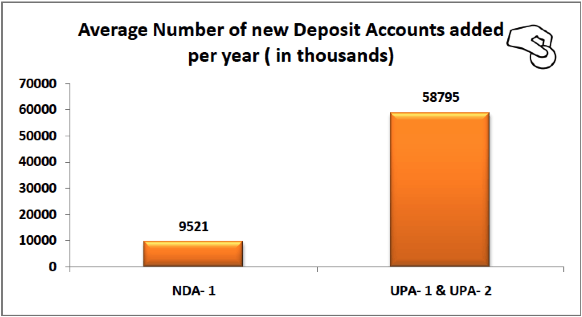
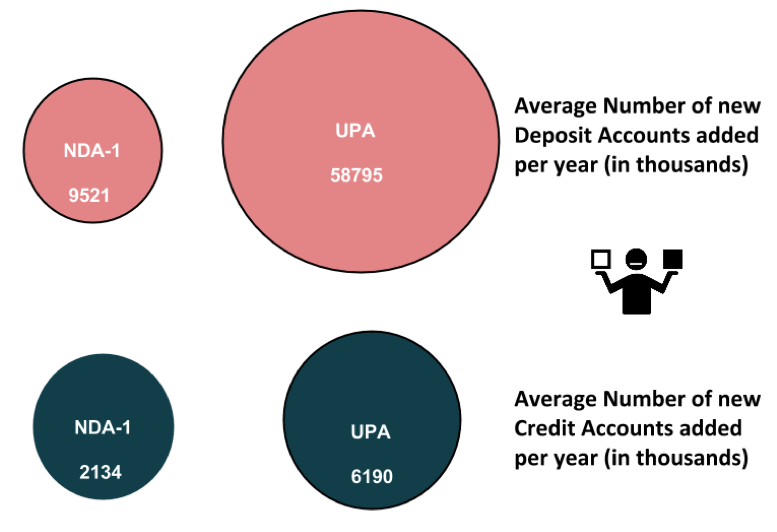
For all scheduled commercial banks, an average of 95 lakh new deposit accounts were added per year during the NDA-1 regime while an average of 5.87 crore new deposit accounts were added per year during the UPA regime. In other words, the average number of new deposit accounts added per year during the UPA regime is 6 times the average number of new deposit accounts added per year during the NDA-1.
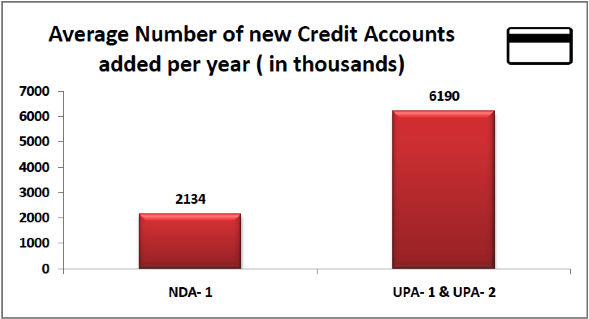
Similar trend is seen in new credit accounts as well. For all scheduled commercial banks, an average of 21 lakh new credit accounts were added per year during the NDA-1 regime while an average of 61 lakh new credit accounts were added per year during the UPA regime. In other words, the average number of new credit accounts added per year during the UPA regime is 3 times more than the average number of new credit accounts added per year during the NDA-1.
| Alliance | Term | Average Number of new Deposit Accounts added per year ( in thousands) | Average Number of new Credit Accounts added per year ( in thousands) |
|---|---|---|---|
| NDA- 1 | 1998-2004 | 9521 | 2134 |
| UPA- 1 & UPA- 2 | 2004-2013 | 58795 | 6190 |
Clearly, UPA had done far better than NDA-1 when it comes to opening new bank accounts. This could be because of host of reforms & initiatives introduced since 2005 to foster financial inclusion. In fact, close to 14 crore new deposit accounts were opened in 2012-13(10 crore in rural & semi urban) while 9 crore were opened in 2011-12.
Growth in Rural Vs Urban Accounts
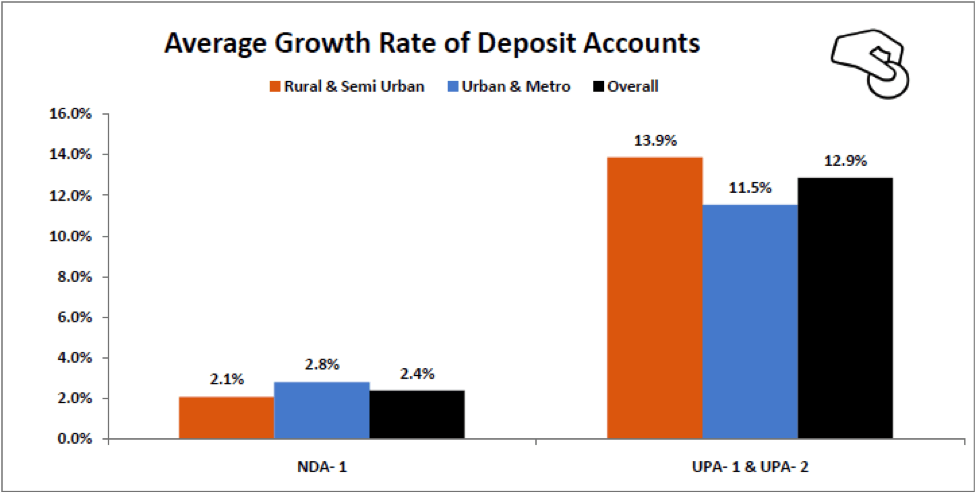
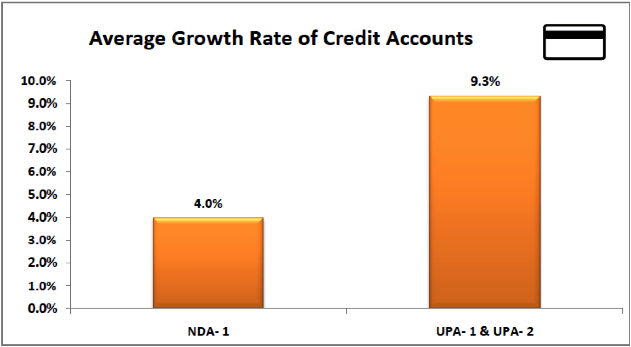
For all the scheduled commercial banks, the data for number of deposit accounts by group of population is maintained by the RBI. For this analysis, Rural & Semi Urban are grouped together while Urban & Metro areas are grouped together. The average growth of deposit accounts in Rural & Semi-Urban areas is greater than the Urban & Metro areas during the UPA regime while it is the opposite during the NDA-1 regime. The pro-poor image of the UPA is probably justified by these numbers. While Rural & Semi-Urban deposit accounts grew by an average of 2.1%, the Urban & Metro deposit accounts grew by an average of 2.8% during the NDA-1 regime. During the UPA regime, the average growth of Rural & Semi-Urban deposit accounts was 13.9% while it was 11.5% for the Urban & Metro deposit accounts. Even with respect to credit accounts, the average growth rate during the NDA-1 regime was 4% while it was 9.3% during the UPA regime.
| Alliance | Term | Average Growth rate in Rural & Semi Urban Deposit Accounts | Average growth rate in Urban & Metro Deposit Accounts | Average Growth rate in Deposit Accounts | Average Growth rate in Credit Accounts |
|---|---|---|---|---|---|
| NDA- 1 | 1998-2004 | 2.1% | 2.8% | 2.4% | 4.0% |
| UPA- 1 & UPA- 2 | 2004-2013 | 13.9% | 11.5% | 12.9% | 9.3% |
Data Sources:
- RTI reply from RBI
- Basic Statistical Returns of Scheduled Commercial Banks in India – Annual Reports from RBI


11 Comments
I wonder we dont have tht much no. Of households in india as much no. Of credit Accnts hs been opened in a period of 9 yrs nly..before n aftr tht is all togthr diff story;)
Sorry..Deposit accnts
Individuals hold accounts and sometimes multiple accounts.
Hi Santosh,
Very nice info highlighting what previous govts. did. But few questions: How many accounts were opened by poor people with zero balance? Also, is it the case that the scenario like awareness, credit,debit cards usage during early 2000s and 2010s has changed a lot which made more people open the bank accounts? Finally, is that the average of UPA has risen because of the consideration of 10years over NDA-1 which was five years?
Jai Hind
Raghu
The rural account growth rate was also much higher during the UPA than NDA 1. Reasons could be many. But an important one is to do with the initiatives by UPA starting 2005 for financial inclusion. Finally, average is not impacted by the number of years. We are not considering absolute numbers but only average.
can you post the number of accounts opened each year from 2004 to 2014 ?
All the data is available in the basic statistical returns of banks on the RBI website
This is complete statistical jugglery n half truths! Governments had very little to do in previous avatars. What ever happened was natural growth.
Secondly by not mentioning the absolute number of deposit accounts the author is hiding a lot.
Let him come out with the complete year end data for last 16 years to make it a Factly article. Sadly, it apparently conceals more than it reveals.
This year’s achievement should be compared with last year’s, not that of 15 years ago.
Utter crap, why is the purpose of comparison made with NDA 1? why are you not comparing it with NDA 2. I have not checked your sources of data but your infographic should clearly show that against 5 cr accounts of UPA in the NDA there have been 13-14 cr (whatever is the exact figure) opened under the Modi government. You cannot take a convenient data point just because it supports your argument and use it to beat a different person.
Why is this article comparing with NDA1 not with NDA2?