The Demonetization exercise in 2016 gave a fillip to digital transactions. Since then, the volume of digital transactions has been steadily increasing. However, because of the lockdown, the volume of digital transactions decreased in April 2020 compared to the previous months.
Digital India is the flagship program of the BJP led NDA government. The campaign was launched in July 2015 with the motive, ‘Faceless, Paperless, Cashless’. That is, through this program, the government aims to incorporate the perks of digitization into governance. Government services are supposed to be made available to citizens online. Promotion of cashless transactions and conversion of India into a less-cash society is also an important goal of the program.
There are two major events since the launch of the Digital India campaign, which may have impacted the volume of digital transactions in the country. First is the demonetization of Rs. 500 and Rs. 1000 notes in November 2016, which was announced in an attempt to unearth black money, plug financing to terrorists and make India a tax compliant and less-cash society. Second is the lockdown which has been imposed currently, as a measure to contain the spread of COVID-19. The current lockdown started on 25 March 2020, and as per the latest Ministry of Home Affairs’ notification, it has been extended up to 17 May 2020, a total of 54 days.
MEITY developed the Digidhan dashboard which helps monitor volume of digital transactions in India
Post demonetization, Ministry of Electronics and Information Technology (MEITY) has been entrusted the task of promoting digital payment transactions. ‘Digidhan mission’ was set up under the ministry, with a target of 2,500 crore digital payment transactions in the financial year 2017-18 and also enable digital payment infrastructure throughout the country. ‘Digidhan dashboard’ was also developed by the ministry to keep track on growth of digital payments and related infrastructure. The data used in this story from 2017-18 is from the dashboard. Data for 2016-17 is from a Lok Sabha response given in 2018 during the previous NDA term.
Digital transactions increased substantially from 2016
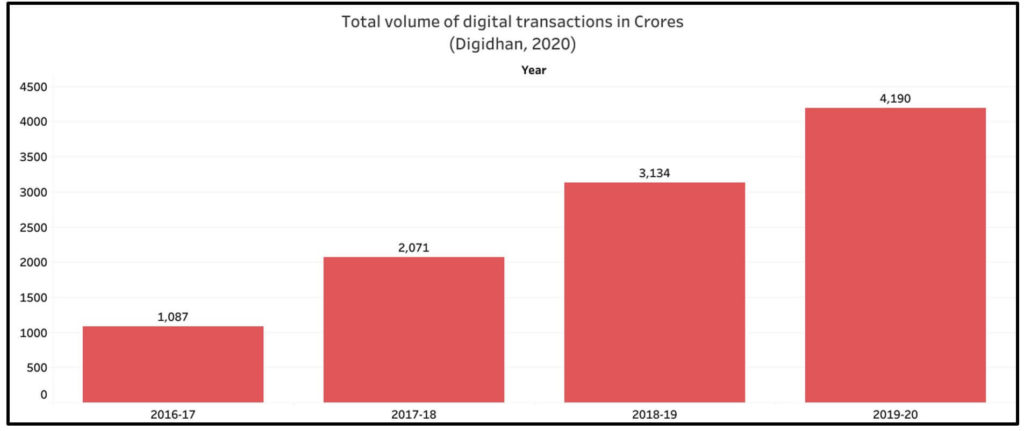
If the annual volume of digital transactions from the financial year 2016-17 is considered, a clear surge in digital payments transactions is evident, as depicted in the following chart. A total of 16 digital payments transaction modes are recorded in the dashboard. These include AEPS, BHIM, BHIM Aadhar, Closed Loop Wallet, Credit and Debit Cards, IMPS, Internet Banking, Mobile Banking, NACH, NEFT, NETC, PPI, RTGS, and Others. For the financial year 2020-21, that is for April 2020, data on all modes of transactions is unavailable. Data for only 8 modes of transactions is recorded for April 2020.
While, in 2016-17, the volume of digital transactions stood at 1,087 crore transactions, it rose to 2,071 crore transactions in the following financial year of 2017-18. It was during financial year 2016-17, that the government announced the unprecedented demonetization exercise which is the prime reason for the 91% increase in digital transactions volume between 2016-17 and 2017-18.
In the subsequent financial years of 2018-19 and 2019-20, the increase of digital transactions stood at 51% and 34% respectively. In the current financial year i.e. 2020-21, between 01 April 2020 and 01 May 2020, the Digidhan dashboard shows that total digital payments transactions stand at 151 Crores. However, it should be noted that the data for April 2020 is incomplete as mentioned above.
Huge increase in 2017 followed by steady increase in the following years
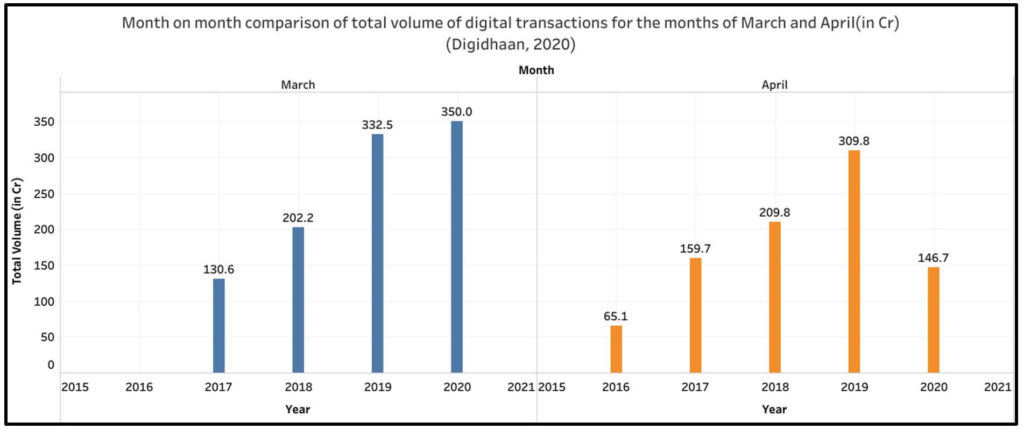
A month on month comparison of the volume of transactions reveals the change in volume in a particular month, in different years. Here, month on month comparison for the months of March and April is made since the nation-wide lockdown was implemented in the end of March and April.
The total volume of digital transactions in April has been on a rise since 2016. The volume of transactions increased by a whopping 145% in April 2017 compared to April 2016, on account of demonetization. The increase has been steady in the following years with 31.4% in April 2018 and 47.6% in April 2019. Similar trend is observed for the month of March. However, a clear dip is observed in the volume of digital transactions in April 2020 (in the financial year 2020-21) on account of the lockdown.
March and April 2020 data is provisional in the case of debit card, credit card, PPI, RTGS and NEFT. Further, data for April 2020 is available only for eight modes of transactions.
Since data for 2020 is available only for eight modes of transactions- Credit and Debit Card, Internet Banking, Mobile Banking, NEFT, PPI, RTGS, and others, a month on month comparison of transaction volumes for these modes for March and April is discussed below.
Increase in Internet and Mobile banking transactions in March 2020
In the month of March 2020, which marks the end of 2019-20, the volume of transactions through internet banking, mobile banking, and NEFT increased considerably compared to March 2019. Transactions through mobile banking have almost doubled compared to 2018. Internet banking transactions increased by almost 11% in March 2020 compared to March 2019. Same is the case in NEFT transactions which increased by around 8%. More than a three-fold increase in the transactions falling in the ‘others’ category was observed in March 2020. The transactions falling in this category include Mobile Wallets such as Paytm, Freecharge, and Mobikwik, Micro ATMs, etc.
April 2020 witnesses a fall in transactions across all modes
Provisional data from the Digidhan website indicates that the volume of digital transactions in April 2020 (in the year 2020-21) decreased across all modes compared to April 2019 (in the year 2019-20). There has been a considerable decline in the volume of credit card, debit card, internet banking and other transactions. This could be the direct result of lockdown where almost all economic activity barring essential services has come to a stand-still. However, between 2017 and 2019, the volume of transactions across all modes witnessed a gradual increase.
Reports show digital transactions initially increased and then plummeted during Lockdown
Initially, when people started to work from home, there was an increase in the volume of digital transactions as most people used online platforms for various payments, grocery shopping and other activities. However, after the lockdown was announced resulting in the closure of most businesses, a clear decline in digital transactions is observed as even e-commence is limited to essential goods. The slump in economic activity is reflected in the decline of digital transactions. Even newspaper reports initially claimed that there has been an increase in grocery shopping online. After that, digital payments have been reported to have plummeted after the initial surge in volumes as consumption has reduced.
Featured Image: Lockdown Effect on Digital transactions
