The Delhi 2015 results are extra ordinary for many reasons. Not even in their wildest dreams, would the BJP & the Congress have dreamt of such drubbing. While the Congress was widely expected to lose and be content with a handful of seats, it is the BJP’s drubbing that left everyone shocked. The AAP wave was so powerful that even Kiran Bedi, the BJP’s Chief Ministerial Candidate lost from Krishna Nagar, the safest seat for the BJP.
[orc]Vote Share & Seats
This is the first time after 1977 that a party got more than 50% of the total vote in Delhi. The AAP polled about 54.3% of the total vote which is highest in the history of Delhi elections. The BJP polled 32.2% while the Congress was a distant third with just 9.7% vote. A 22% lead over BJP meant that the AAP virtually decimated both the BJP & the Congress by winning 67 of the 70 seats (more than 95% of the total seats) while the BJP had to be content with just 3 seats. The Congress drew a blank.
| Party | Seats Won | Vote Share |
| AAP | 67 | 54.3 |
| BJP | 3 | 32.2 |
| Congress | 0 | 9.7 |
| Others | 0 | 3.8 |
| Total | 70 | 100 |
Record Vote Share for AAP & Record number of Seats
The 54.3% vote share is the highest in the history of Delhi elections. There have been only two instances in the history of Delhi elections where a party won more than 50% of the votes. First was way back in 1951 during Nehru’s time and the second time was during the Janata Party wave in 1977.
(In 1972, 1977 & 1983, elections were held to the Delhi Metropolitan Council established under the Delhi Administration Act, 1966. These elections were as good as assembly elections. Hence they are included in the Analysis)
| Year | Winning Party | Vote Share of the leading Party | Lead over the nearest rival | % of Seats won |
| 1951 | Congress | 52.1 | 30.2 | 81.3% |
| 1972 | Congress | 48.5 | 10.1 | 78.6% |
| 1977 | Janata Party | 52.6 | 16.4 | 82.1% |
| 1983 | Congress | 47.5 | 10.5 | 60.7% |
| 1993 | BJP | 42.9 | 8.4 | 70% |
| 1998 | Congress | 47.8 | 13.8 | 74.3% |
| 2003 | Congress | 48.1 | 12.9 | 67.1% |
| 2008 | Congress | 40.3 | 4 | 61.4% |
| 2013 | Hung | 33.1 | 3.6 | 44.3% |
| 2015 | AAP | 54.3 | 22.1 | 95.7% |
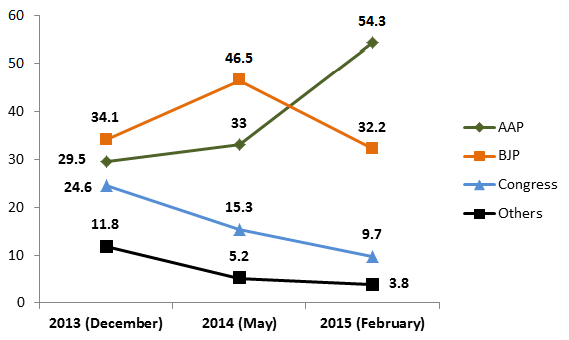
What changed from 2013 to 2015?
Delhi has witnessed three elections from 2013 to 2015; two Assembly elections & one Lok Sabha election in 2014. The change in fortunes of the various parties is fascinating. While the Congress went into decline mode from 2013 to 2015, the BJP peaked during the 2014 Lok Sabha elections on the back of a national resurgence. The BJP lost more than 14% of the vote in 2015 compared to the Lok Sabha elections in 2014. Though it managed to get more or less the same vote share as in December 2013, the AAP went so far ahead of BJP that there was 22% difference in the vote share of AAP & BJP this time around. The AAP gained close to 25% vote share compared to December 2013 & 21% compared to the Lok Sabha election in May 2014.
| Party | Dec -13 Assembly | May-14 Lok Sabha | Feb -15 Assembly | |||
| Seats Won | Vote Share | Lead in | Vote Share | Seats Won | Vote Share | |
| AAP | 28 | 29.5 | 10 | 33 | 67 | 54.3 |
| BJP | 31 | 34.1 | 60 | 46.5 | 3 | 32.2 |
| Congress | 8 | 24.6 | 0 | 15.3 | 0 | 9.7 |
| Others | 3 | 11.8 | 0 | 5.2 | 0 | 3.8 |
| Total | 70 | 100 | 70 | 100 | 70 | 100 |
As can be clearly seen, the Congress is in a continuous decline while the BJP peaked in 2014 and is went down in 2015. The AAP seems to be the only party that has consistently increased its vote share from 2013 to 2015.
The 2015 story
The elections in 2015 have thrown up a lot of surprises. In terms of vote share lost or gained compared to 2013 & 2014, AAP is the only party that has gained vote share both times.
| Party | Change in Vote share compared to December 2013 | Change in Vote share compared to May 2014 |
| AAP | 24.8 | 21.3 |
| BJP | -1.9 | -14.3 |
| Congress | -14.9 | -5.6 |
| Others | -8 | -1.4 |
Some highlights of the Delhi 2015 elections
- The Congress candidates forfeited their deposits in 62 of the 70 constituencies.
- The Congress stood second in just 4 of the 70 constituencies (Badli, Mangolpuri, Matia Mahal & Mustafabad).
- The BJP’s vote share reduced in all the 70 constituencies compared to the Lok Sabha election in May 2014.
- AAP Candidates polled more than 60% of the total vote in 11 of the 70 constituencies.
- AAP doubled its vote share compared to 2013 Assembly elections in 28 of the 70 constituencies while it tripled its vote share in 9 of the 70 constituencies.
- In Ballimaran, AAP increased its vote share by 4 times compared to 2013. AAP candidate Imran Hussain became the giant killer defeating five time MLA & former minister Haroon Yousuf who is relegated to the fifth position.
- The BJP won only in 3 constituencies despite getting a 32.2% vote share. It won on Mustafabad, Rohini & Vishwas Nagar.
- 45 AAP candidates won by a margin of more than 20000 votes.
- 28 AAP candidates won by a margin of more than 30000 votes.
- 15 AAP candidates won by a margin of more than 40000 votes
- 6 AAP candidates won by a margin of more than 50000 votes
Assets & Criminal Cases of newly elected MLAs
| Party | AAP | BJP | Total |
| Number of Crorepati MLAs | 41 | 3 | 44 |
| Average Assets of an MLA in Rs Crore | 4.75 Crores | 13.94 Crores | 5.15 Crores |
| Number of MLAs with Pending Criminal Cases | 23 | 1 | 24 |
All the statistics are sourced from the website of Election Commission of India


2 Comments
Amazing work.
Pingback: THE CONUNDRUM OF STITCHING AN ALLIANCE – The Journal