[orc]India has had 16 general elections to the Lok Sabha so far. The number of eligible voters went up from 17.3 crores in 1951 to 83.40 crores in 2014. While only 53 political parties contested the first Lok Sabha election in 1951, 465 political parties contested in 2014.
Much has changed in the country from the time of the first general election to the Lok Sabha in 1951 to the 16th general election in 2014. A lot of numbers related to elections have also changed, from voter turn out to polling booths to contesting political parties.
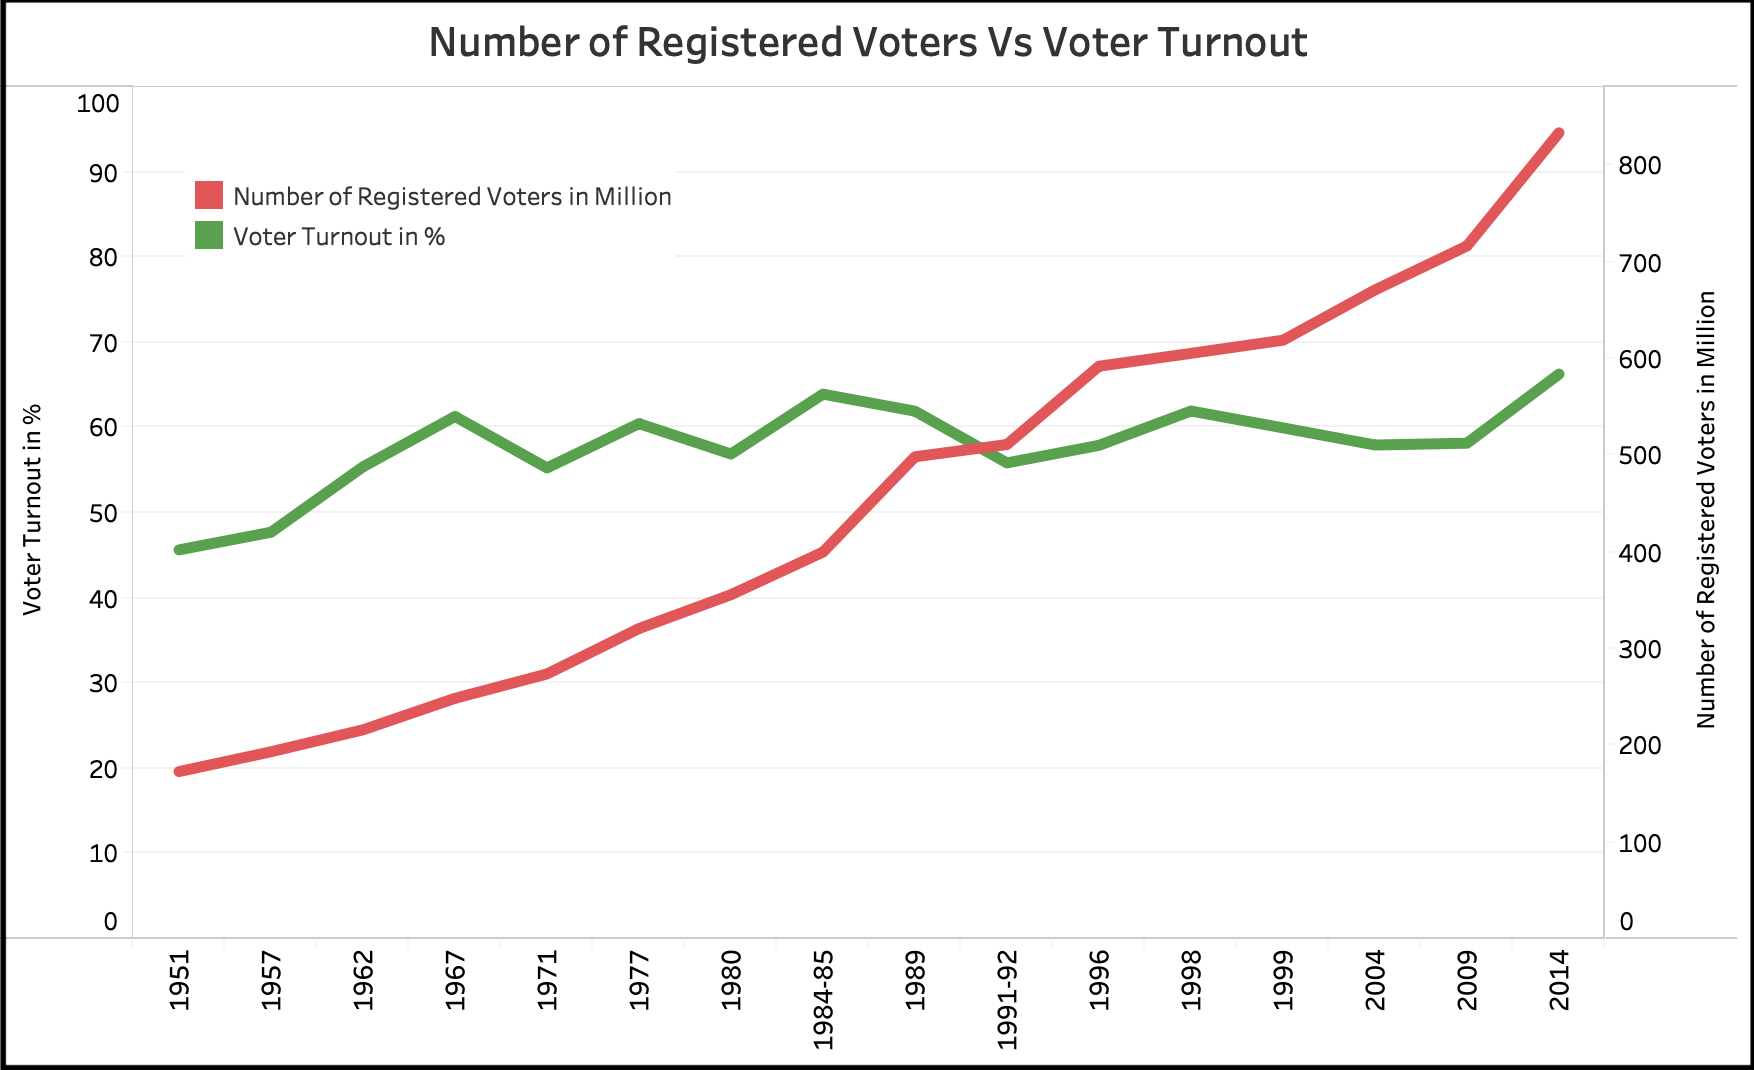
More Voters & Mixed Turnout
While the number of registered voters has increased continuously from the first general election in 1951, the voter turnout has been a mixed bag without a specific trend except the first two general elections. In the first ever general election to the Lok Sabha in 1951, there were only 17.3 crore registered voters and the voter turnout was 45.7%, the lowest ever turnout till date. The voter turnout increased to 47.8% in 1957. These were the only two elections where the turnout was less than 50%. Starting from 1962, the voter turnout has fluctuated (increasing & decreasing alternatively) till 1989. In the elections that were held in 1991-92, the voter turnout further went down to 55.88%, the lowest in the last 25 years. After that, the voter turnout increased in both 1996 and 1998 elections only to drop again in both 1999 and 2004 elections. The voter turnout slightly improved in 2009 while the highest ever voter turnout in the India’s Lok Sabha election history was in the 2014 elections. A record 66.3% voters turned up at the polling booths in 2014. Of the 16 general elections to the Lok Sabha so far, the voter turnout was less than 60% on 10 different occasions and more than 60% on six other occasions.
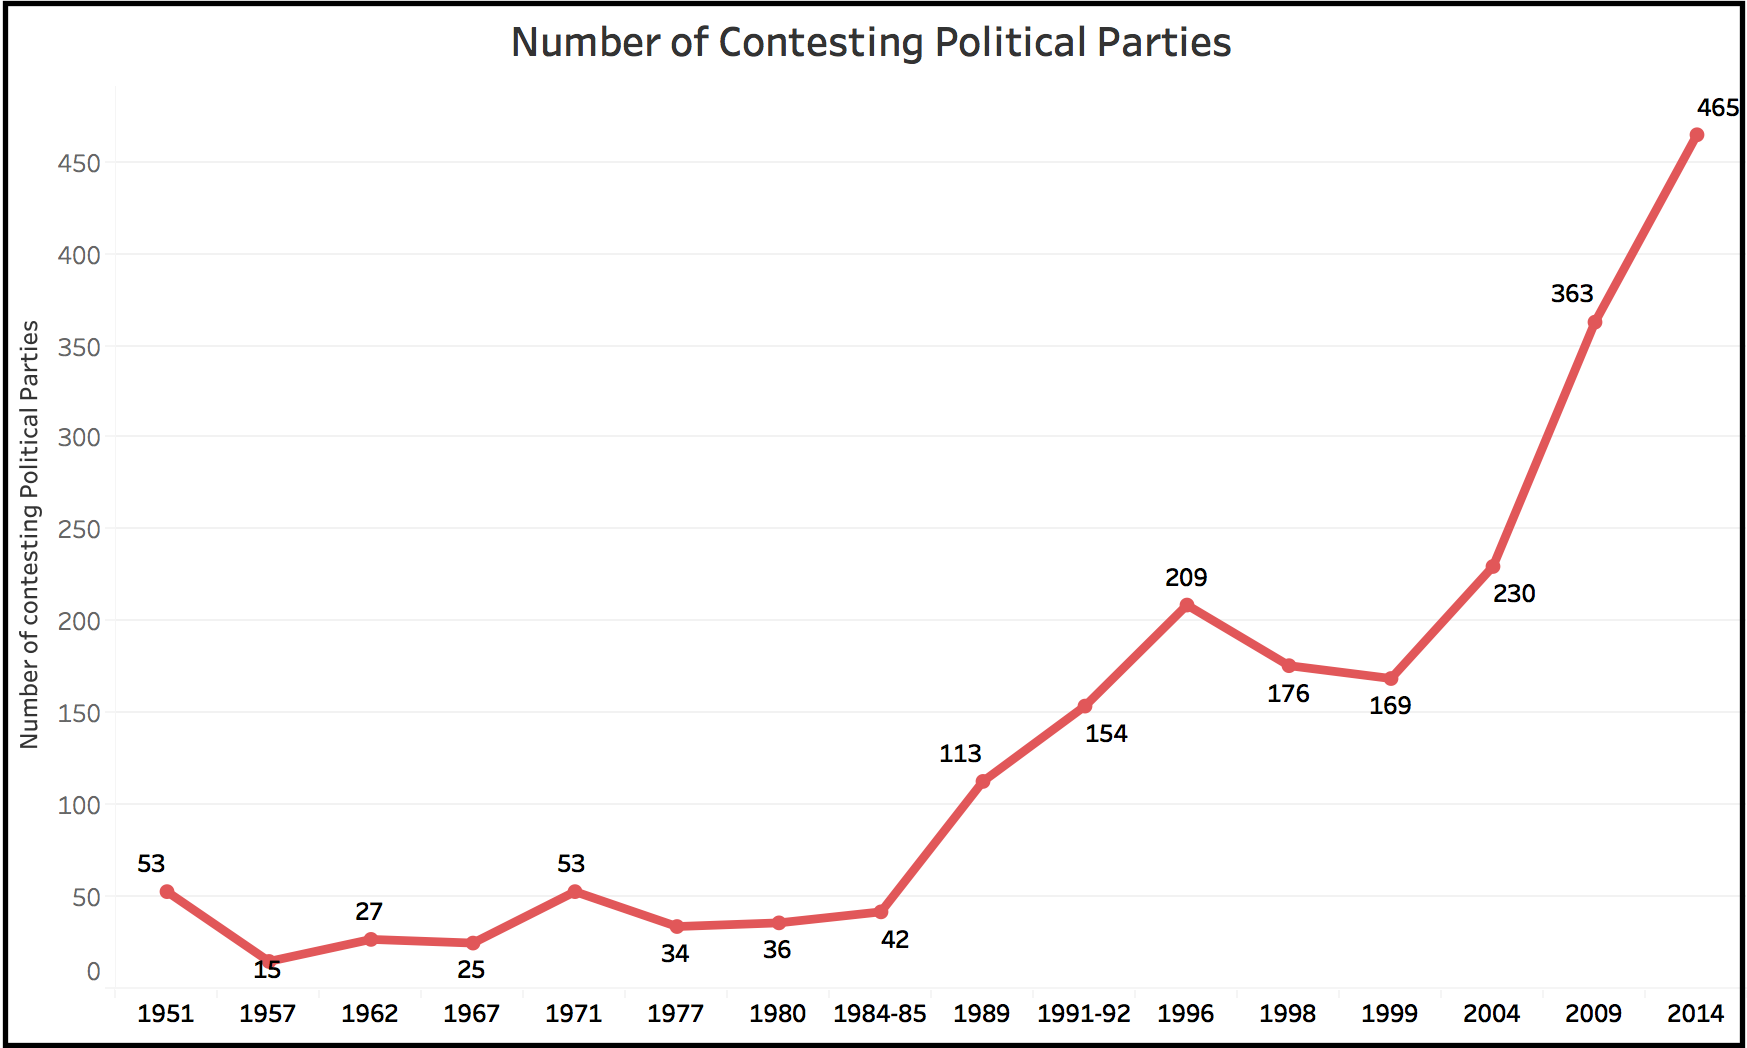
 Nine fold jump in the number of contesting Political Parties
In the 1951 election, a total of 53 political parties contested while this number was just 15 in the 1957 election. The number of contesting political parties remained more or less around 50 for most of the elections till 1984-85. In the 9th general election in 1989, the number of contesting political parties crossed 100 for the first time. Since then, this number has been on the rise. This could be due to the emergence of strong regional and local parties in various parts of the country from the later half of 1980s. In 2009, 363 political parties contested elections while this number went up to 465 in 2014. By last count, there are more than 2000 registered political parties in the country. In other words, not more than 25% of the registered political parties contest elections. The trend of registering political parties without contesting elections has gone up in the last decade.
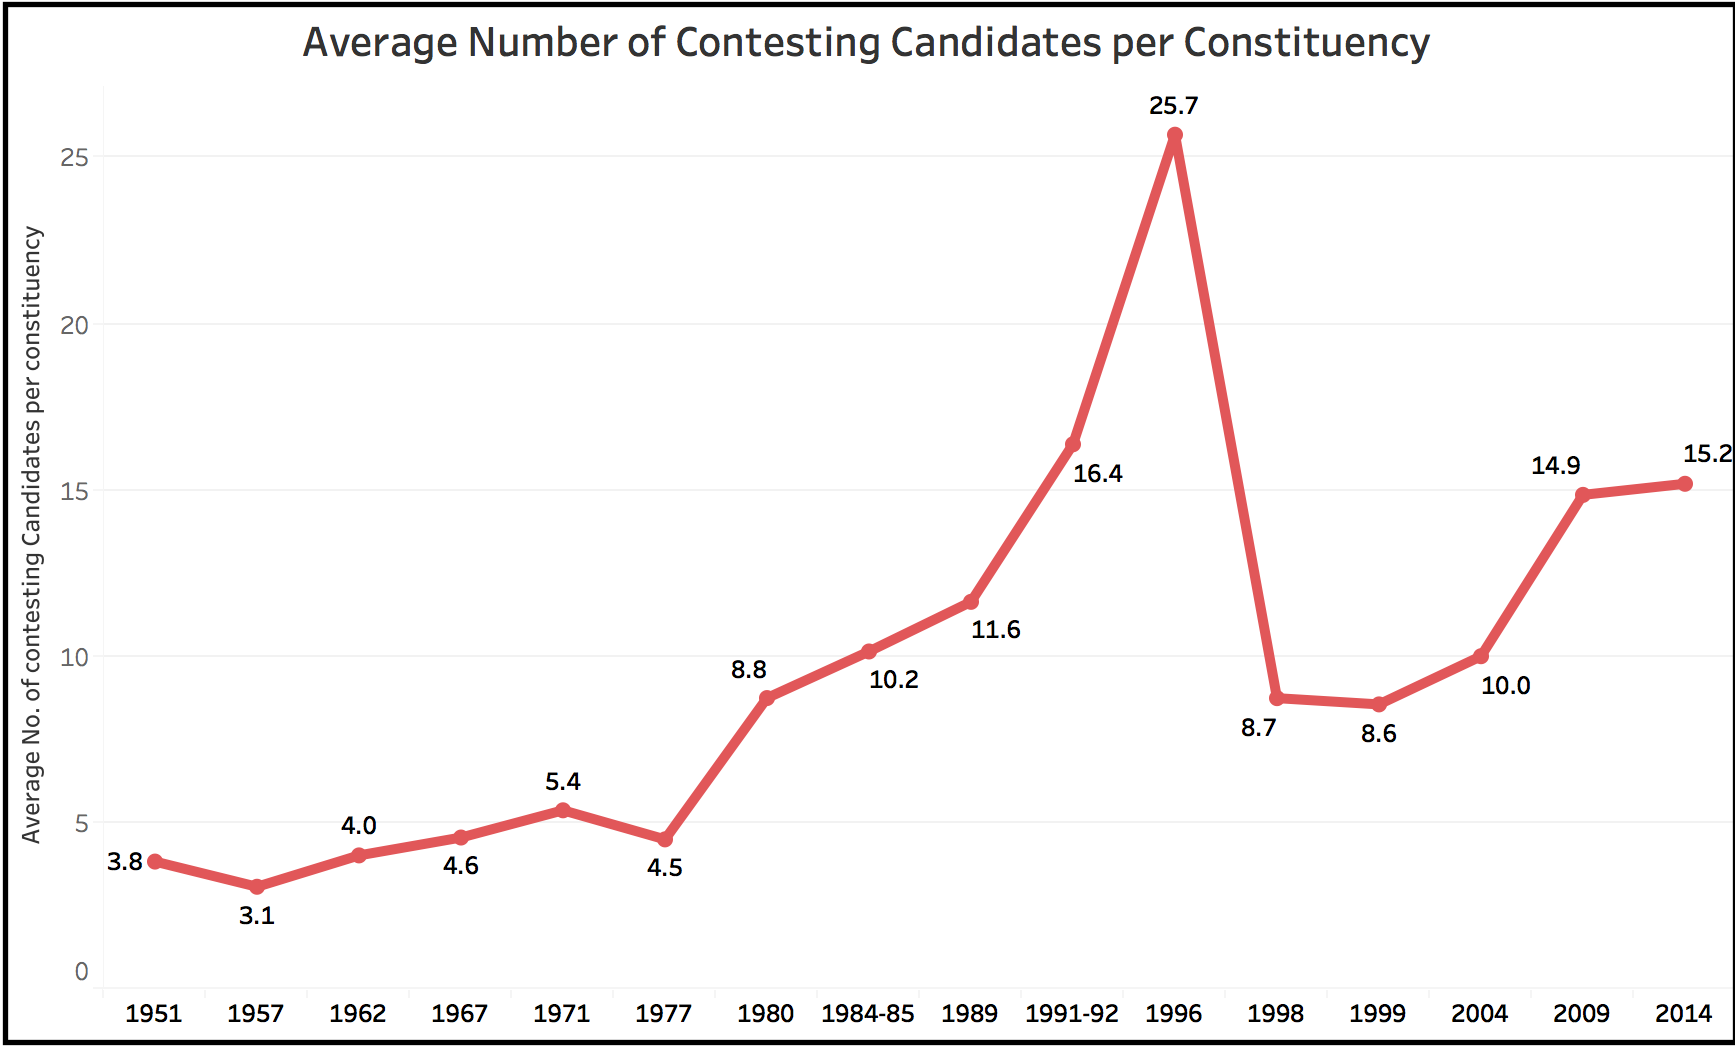
 From an average of 3 Contestants per Constituency to 25 per Constituency
From about an average of three contestants per constituency in 1957, the average number of contestants went up to a maximum of 25.7 per constituency in 1996. The average number of contestants remained between 3 and 5 for the first six general elections up to 1977. In the 7th general election in 1980, the average went up to 8.8. After 1980, this increased continuously to reach 25.7 in 1996. The Election Commission of India increased the amount of the security deposit from a mere Rs. 500 to Rs. 10,000 after the 1996 elections. This was further increased to Rs. 25,000 in the year 2009. This move helped in bringing down the average number of contestants per constituency to 8.75 candidates in 1998 elections. Since 1999, the average has again been on the rise to reach 15.2 in 2014.
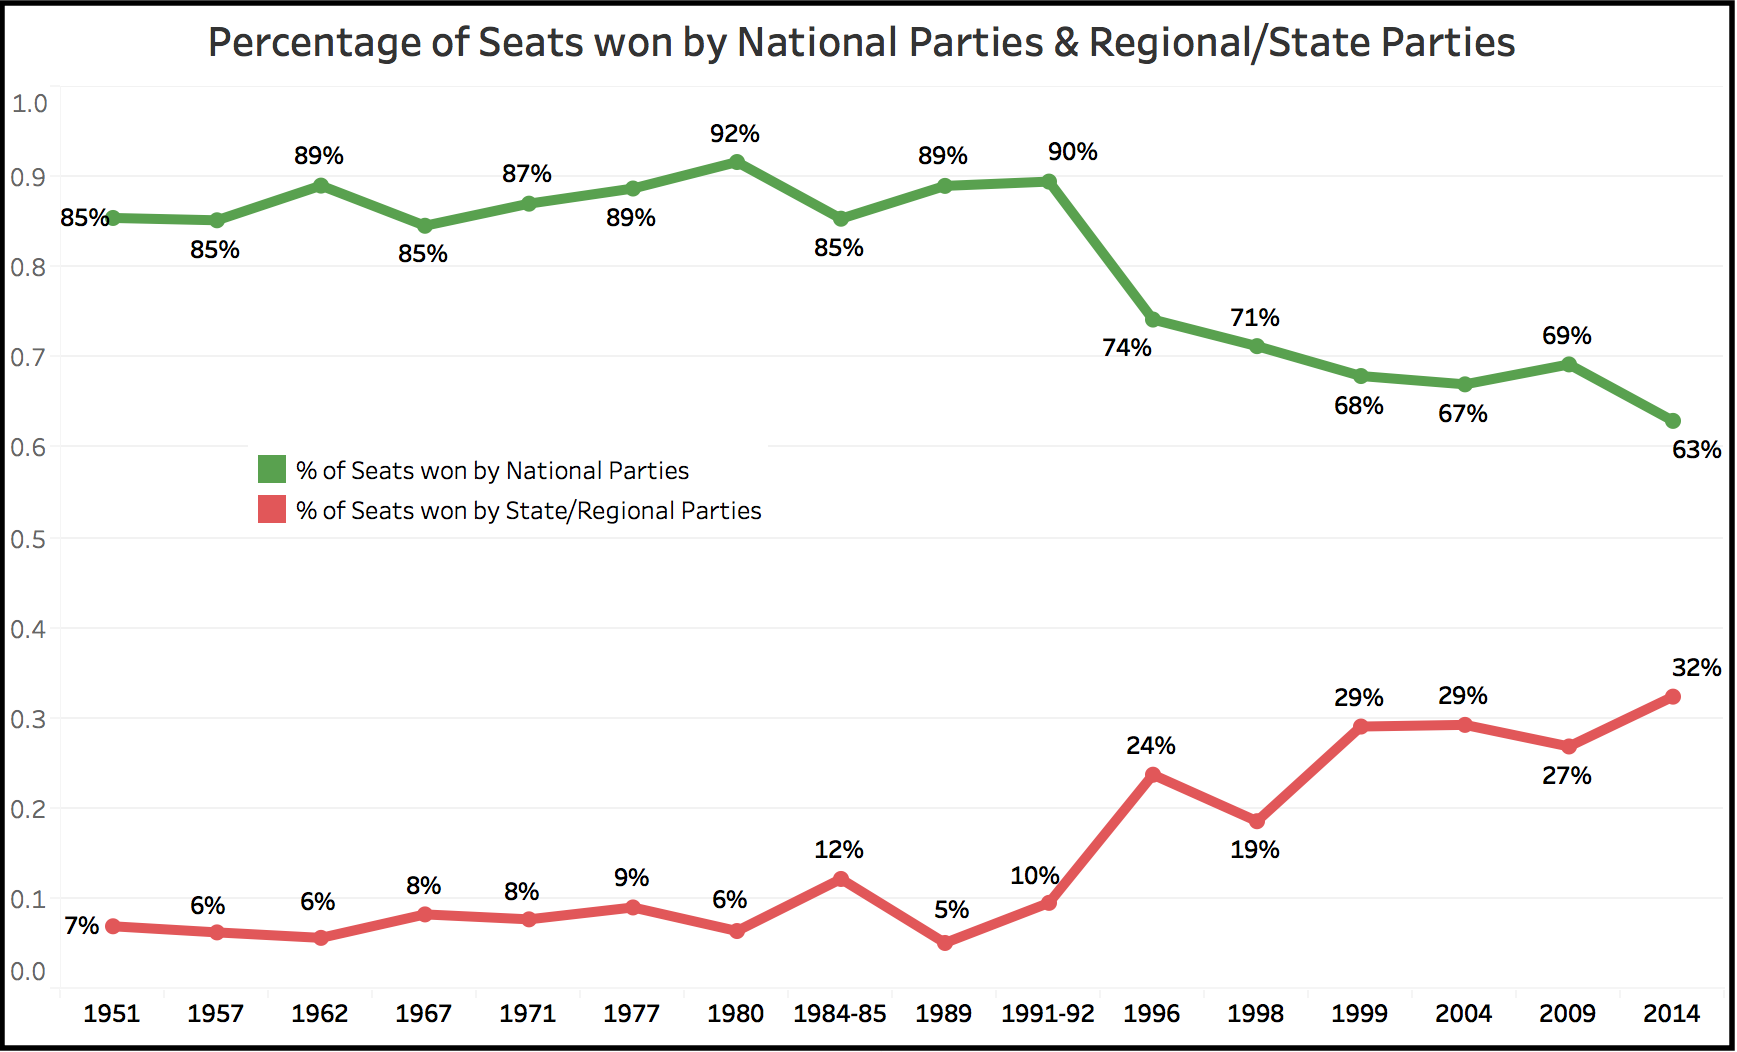
 Regional Parties gain strength
The National parties won more than 80% of the seats in each of the first ten general elections from 1951 to 1991-92. It is only after 1992, the regional parties emerged stronger and have consistently won more than 20% of the seats in almost every election held after 1992. The regional/state parties won close to 1/3rd of all the seats on offer in 2014 despite the BJP getting a majority on its own. This was also aided by the Congress’s worst ever performance in 2014. In 2014, National parties won 342 seats (282 by the BJP) and the regional/state parties won 176 seats.
Featured image: (Photo Courtesy: iaIGO; International Association International Gulf Organization)


2 Comments
Pingback: Where are the voters?! – Nirmaan Goa
Pingback: Why Do We Vote? | Catharsis Magazine