 Government Data Roundup: QES, Index of Eight Core Industries, Public Debt Management report, Envi Stats India 2022 among the data released recently.")
In the thirteenth edition of the ‘Government Data Roundup’, we cover Quarterly Employment Survey (QES), Index of Eight Core Industries for August 2022, Public Debt Management report for the quarter of April-June (Q1 of FY 22-23), Consumer Price Index for Industrial Workers – August 2022, Results of Forward-Looking Surveys by RBI, India Productivity Report by RBI, Envi Stats India 2022, among others.
The thirteenth edition of the fortnightly government data roundup covers the Fourth Round (January-March,2022) of Quarterly Employment Survey (QES), Index of Eight Core Industries for August 2022, Public Debt Management report for the quarter of April-June (Q1 of FY 22-23), Consumer Price Index for Industrial Workers – August 2022, Results of Forward Looking Surveys by RBI, India Productivity Report by RBI, Envi Stats India 2022 Volume II Environment Accounts, and State-wise and Item-wise Value of Output from Agriculture, Forestry and Fishing (Year: 2011-12 to 2019-20).
In addition to these reports, some quick highlights of this fortnight are as below:
- The Bharat skills learning platform was created by the Directorate General of Training, Ministry of Skill Development and Entrepreneurship in 2019. Now, a new feature called the ‘Bharat skills Forum’ is added that enables learners to share books, notes, videos, question banks, and other pertinent skill-related content. By enabling the sharing of content in multiple forms, such as handwritten trainer or trainee notes, PDFs, scanned copies, or recorded films in any language, this service is intended to serve as a digital storehouse for the skilling community.
- To encourage reading, writing, and book culture in the nation and project India and Indian writings internationally, the Ministry of Education’s Department of Higher Education launched YUVA 2.0 – Prime Minister’s Scheme for Mentoring Young Authors, an Author Mentorship programme to train young and aspiring authors (under 30 years of age). A significant number of young and aspiring authors participated in the first YUVA edition.
- The Telecom Technology Development Fund (TTDF) Scheme was launched by the Department of Telecommunications’ Universal Service Obligation Fund (USOF). The Telecom Technology Development Fund (TTDF) aims to finance research and development (R&D) in applications of communication technology that are specifically for rural areas and to create synergies between academia, start-ups, research institutes, and the industry to create and develop the telecom ecosystem. The Scheme also seeks to encourage indigenous manufacturing and technology ownership, foster a culture of technological collaboration, lower imports, increase export opportunities, and foster the development of intellectual property.
The 6th India Mobile Congress was officially opened by the Prime Minister, who also introduced 5G services in India. Speaking to the group, the prime minister declared that the arrival of 5G signals the beginning of a new era for the nation. India will actively participate in the creation and application of the technology and Future wireless technology design and related production will be heavily influenced by India.
| Report name | Fourth Round of Quarterly Employment Survey (January-March 2022) |
| Sector | Labour & Employment |
| Agency responsible | Ministry of Labour & Employment |
| Frequency of release | Quarterly |
| Source Link | Fourth Round of Quarterly Employment Survey (January-March 2022) |
Brief about the report/data:
The Area Frame Establishment Survey (AFES) and the Quarterly Employment Survey (QES) are the two components of the All-India Quarterly Establishment based Employment Survey (AQEES). The former applies to businesses with 9 or less employees, while the latter applies to businesses with 10 or more workers. The QES, which is a component of the AQEES, was introduced in April 2021 to collect crucial data regarding employment & related variables in the organised sector of the economy. In each quarter, information is being collected from about 12,000 establishments. The first such report for the period April-June 2021 was released in the month of September 2021.
Key Highlights:
- The estimated employment grew from 3.08 crore in the first quarter to 3.10 crore in the second, 3.14 crore in third quarter and to 3.18 in fourth quarter (January-March 2022).
- An estimated 80% of the establishments, when measured by the number of employees, employed 10 to 99 people. If we just include businesses with 10 or more employees, the percentage rises to 88%. 12% of the businesses reported having fewer than 10 employees.
- The manufacturing sector employs most people (38.5%), followed by the education sector (21.7%), the IT/BPO sector (12%), and the health sector (10.6%).
- Only 1.4% of the businesses reported having at least 500 employees. The IT/BPO sector and the health sector accounted for most of these sizable establishments.
- The percentage of female employees increased slightly from 31.6% in the third quarter to 31.8% in the fourth quarter report. However, female employees made up around 52% of the workforce in the health sector, compared to 44%, 41%, and 36% in the education, financial services, and IT/BPO sectors, respectively. It is noteworthy that there are significantly more women than men who are self-employed in the financial services sector.
| Report name | Index of Eight Core Industries for August, 2022 |
| Sector | Economy |
| Agency responsible | Ministry of Commerce & Industry |
| Frequency of release | Monthly |
| Source Link | Index of Eight Core Industries for August, 2022 |
Brief about the policy:
Index of Eight Core Industries (ICI) is a production volume index that evaluates the performance of each core industry, both individually and collectively. Due to their significant influence on other industrial activities as well as general macro-economic activity, these sectors are known as core industries. These industries in the order of their weight in the index are Petroleum Refinery Industry (28.04%), Electricity (19.85%), Steel (17.92%), Coal (10.33%), Crude Oil (8.98%), Natural Gas (6.88%), Cement (5.37%), and fertilizers (2.63%). These sectors account for a combined 40.27% of the weighted average of all the items included in the Index of Industrial Production (IIP).
The compilation and releasing of the index are done by the Office of the Economic Adviser (OEA), Department of Industrial Policy and Promotion, Ministry of Commerce, and Industry.
Key highlights:
- Compared to the Index of August 2021, the Index of the Eight Core Industries for August 2022, a gain of 3.3% (provisional) was seen. August 2022 saw an increase in the output of steel, cement, coal, refinery products, fertilisers, and electricity compared to the same month previous year.
- The Index of Eight Core Industries’ actual growth rate for May 2022 is revised from its provisional reading of 18.1% to 19.3%. ICI’s growth rate from April through August of 2022–2023 was 9.8% (P) higher than it was during the same time period the previous fiscal year.
- In terms of each industry, production of coal increased by 7.6% in August 2022 compared to August 2021, but production of crude oil, natural gas, and petroleum refineries all decreased by 3.3%, 0.9%, and 7.0%, respectively. The production of Fertilizers, steel, cement, and electricity rose by 11.9%, 2.2%, 1.8%, and 0.9%, respectively.
- The cumulative index for coal climbed by 22.7% from April to August of 2022-23 compared to the same time the year before, while it decreased by 1.1% for crude oil, increased by 2.6% for natural gas, increased by 10.8% for fertilisers, increased by 11.4% for the petroleum refinery business, increased by 5.8% for steel, increased by 10.6% for cement, and increased by 10.5 % for the power sector.
Brief about the report:
The Public Debt Management Cell (PDMC), Budget Division, Department of Economic Affairs, Ministry of Finance has been releasing a quarterly report on public debt management since April through June (Q1) 2010–11. The report contains details on many aspects of debt management and provides an assessment of the public debt management and cash management operations during the quarter.
| Report name | Public Debt Management report for the quarter of April-June (Q1 FY22-23) |
| Sector | Economy |
| Agency responsible | Ministry of Finance |
| Frequency of release | Quarterly |
| Source Link | Public Debt Management report for the quarter of April-June (Q1 FY22-23) |
Key Highlights:
- As per the provisional data, the Government’s total gross liabilities (including obligations under the ‘Public Account’) climbed from Rs. 1,39,58,774 crore at the end of March 2022 to Rs. 1,45,72,956 crore at the end of June 2022. This was an increase of 4.40% quarter over quarter in Q1 FY23. At the end of June 2022, public debt made up 88.3% of all gross liabilities, a slight increase from the 88.1% at the end of March 2022.
- According to estimates of the Gross Domestic Product (GDP) for the first quarter (April–June) of 2022–23, the real GDP at constant prices increased by 13.5% in Q1 2022–23 compared to Q1 2021–22’s growth of 20.1%.
- During Q1 of FY23, the weighted average yield (WAY) on new issuances hardened to 7.23% while the weighted average maturity (WAM) of issuances worked out to 15.69 years.
- The Central Government’s cash position remained positive during Q1 FY23, eliminating the need for WMA or the issuing of Cash Management Bills. Oversupply market liquidity conditions persisted in the six-month period that concluded in June 2022.
- At the end of June 2022, there were more debt (dated securities) due in less than a year, 4.14% (3.88% at end-March 2022). At 24.76% at the end of June 2022, the percentage of debt with a maturity of 1 to 5 years was lower than the 25.43% at the end of March 2022.
- According to the ownership patterns of Central Government securities, commercial banks’ share increased from 37.75% at the end of March 2022 to 38.04% at the end of June 2022. At the end of June 2022, the shares of insurance firms and provident funds were 26.34% and 16.06% respectively.
| Report name | Consumer Price Index for Industrial Workers – August, 2022 |
| Sector | Economy |
| Agency responsible | Ministry of Labour & Employment |
| Frequency of release | Monthly |
| Source Link | Consumer Price Index for Industrial Workers – August, 2022 |
Brief about the report:
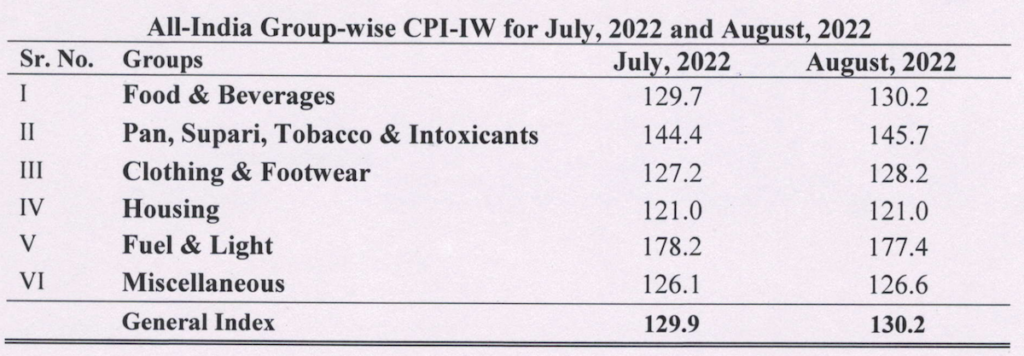
The Consumer Price Index for Industrial Workers is compiled each month by the Labour Bureau, an associated office of the Ministry of Labour & Employment, using retail prices gathered from 317 markets dispersed across 88 industrially significant centres in the nation. On the last working day of the next month, the index—which is compiled for 88 centres and All-India—is released. This press release contains the index for the month of August 2022.
Key Highlights:
- For August 2022, the All-India CPI-IW increased by 0.3 points to 130.2.
- Compared to the gain of 0.16% between the same months a year earlier, it climbed by 0.23% over the preceding month in terms of percentage change.
- The Food & Beverages group exerted the most upward pressure on the current index, giving 0.19% points to the overall change.
- Inflation was 5.85% year over year for the month, up from 5.78% the month before and 4.80% in the same month a year prior.
- Similarly, food inflation was 6.46%, up from 5.96% in the previous month and 4.83% in the same month a year ago.
| Report name | Results of Forward-Looking Surveys by RBI |
| Sector | Economy |
| Agency responsible | RBI |
| Frequency | – |
| Source Link | Results of Forward-Looking Surveys by RBI |
Brief about the report:
The Reserve Bank of India (RBI) carries out a series of forward-looking surveys on a regular basis before making any significant macro decisions to find out more about how consumers, businesses and other stakeholders feel about the current economic situation and expectation for the future. These surveys are useful in and of themselves because they give decision-makers and other economic actors more qualitative information on the business sentiment that might be influencing business circumstances and actions, even for the foreseeable future.
Key Highlights:
- Although the current situation index (CSI) remained in negative territory, it improved in the most recent survey round. Consumer confidence has been on recovery path since July 2021 after the impact of COVID-19 pandemic waned. Although most households expect increasing incomes over the coming year, households indicated pessimism about their current income in the Consumer Confidence Survey.
- Households’ median inflation perceptions for the current period climbed by 90 basis points from July 2022 to 10.2% in September 2022, while they increased by 50 bps for the next three months and the next year. Most respondents anticipate greater inflation for the next three months as well as the next year in the Households’ Inflation Expectations Survey.
- As the COVID-19 pandemic’s impact waned more in Q2 of 2022-23, business conditions in the manufacturing sector continued to improve. Despite a little decline, respondents’ optimism about demand conditions in Q3 persisted, as derived in Industrial Outlook Survey of the Manufacturing Sector.
- In the Bank Lending Survey, across all significant sectors, bankers evaluated improvement in loan demand sequentially. For loans for infrastructure, mining, and agriculture, respondents indicated simple lending terms and conditions, albeit with some sluggishness.
- During Q2:2022-23, businesses in the services sector observed a significant improvement in both their general business environment and their turnover. While there has been some relief in the pressure on input costs, attitudes toward the cost of financing and labour have remained positive, as derived from the Services and Infrastructure Outlook Survey.
| Report name | India Productivity Report |
| Sector | Economy |
| Agency responsible | RBI |
| Frequency of release | – |
| Source Link | India Productivity Report |
Brief about the report:
The India Productivity Report is a thorough analysis of productivity dynamics in Indian industries, principally using the India KLEMS database. The India KLEMS project, which adheres to the World KLEMS and EU KLEMS standards, offers a database on capital, labour, and intermediate inputs together with total factor productivity, making it easier to compare India’s productivity trends with those of other major players in the world. It is crucial in determining how productivity, factor accumulation, and structural change affect the Indian economy.
Key Highlights of the report:
- In terms of broad industries, the services sector increased more quickly each year (7.3%) than the others, whereas agriculture grew at a significantly slower rate each year (3.1%).
- Between 1980 and 2017, the Indian economy experienced a major transformation in the employment structure. The percentage of manufacturing employment decreased from 70% to 42% and services increased from 17% to 34%, respectively, whereas the percentage of agriculture employment decreased from 70% to 42%. Between 1981 and 2017, India’s employment increased by 1.3% a year on average.
- In India, the workforce participation rate (WFPR) dropped from 38.6% in 2011–12 to 34.7% in 2017–18, which is consistent with almost no employment growth during 2008-17.
- A positive structural change effect is suggested by the static reallocation effect, which shows that workers have moved to industries with significantly higher productivity levels. This effect accounts for 25% of the overall productivity gain between 1981 and 2017 and has been positive.
- However, a cross-country comparison shows that India’s level of labour productivity is still quite low when compared to other chosen countries, despite having one of the highest average annual growth rates of 5% between 1981 and 2017.
- The 27 India KLEMS industries’ output growth rates, according to an analysis of industry-level output growth rates for the years 1981 to 2017, are distributed normally, with the bulk of the industries exhibiting annual output growth rates that are closer to the all-industry average of 7.39%.
| Report name | Envi Stats India 2022 Volume II Environment Accounts |
| Sector | Environment |
| Agency responsible | Ministry of Statistics and Programme Implementation |
| Frequency of release | – |
| Source Link | Envi Stats India 2022 Volume II Environment Accounts |
Brief about the report:
An international statistical standard called the System of Environmental-Economic Accounting (SEEA) integrates economic and environmental data using a systems approach to calculate how much the environment contributes to the economy and how much the economy affects the environment.
The National Statistical Office (NSO) has the responsibility of ‘Developing Environment Statistics and Development of Methodology, Concepts and Preparation of National Resource Accounts for India’. The Ministry has worked to expand the range and depth of environmental accounts. Fifth in the series, this paper covers Energy Accounts, Solid Waste Accounts, Wetlands including Mangroves and Estuaries, Fish Provisioning Services, Forest Ecosystems Accounts, and Species. Richness of Species on the IUCN Red List
Key Highlights:
- In India, there are currently 55.76 million hectares of wasteland, or a huge 16.96% of the country’s total land area, as of 2015–16.
- A total of 912,06,650 hectares of land were included in the land degradation account as of 2015–16. This is less than the opening stock in 2005–2006, which was 912,98,196 hectares.
- According to India’s Asset Account for Land Use and Land Cover (LULC), the amount of land that is fallow for agriculture, snow, and glaciers has increased, while the amount of deciduous and evergreen forest has decreased from 2005-2006.
- The Gini Index of Land Concentration, a gauge of fragmentation, declined slightly from 0.59 to 0.57 between 2005-06 and 2015-16. The degree of inequality is further demonstrated by the fact that small and marginal holdings, collectively comprising 0.00–2.00 ha, made up 86.08% of all holdings in 2015–16 as opposed to 85.01% in 2010–11, and that their percentage of the operational area increased to 46.9% from 44.6% to 2015–16.
- The average operating holding size decreased from 1.15 hectares in 2010–11 to 1.08 ha in 2015–16. By 2020–21, this is most likely to decline even more.
| Report name | State-wise and Item-wise Value of Output from Agriculture, Forestry and Fishing (Year: 2011-12 to 2019-20) |
| Sector | Agriculture |
| Agency responsible | Ministry of Statistics and Programme Implementation |
| Frequency of release | – |
| Source Link | State-wise and Item-wise Value of Output from Agriculture, Forestry and Fishing (Year: 2011-12 to 2019-20) |
Brief about the index:
Over the years, National Accounts Division (NAD) has gathered a sizable body of data during the investigation and creation of estimates of national income related macro-aggregates emanating from agriculture. It became necessary for a domain-specific publication to provide a lengthy time-series of data on ‘Gross Value of Output’ (GVO) for the items belonging to the agricultural and related industries in one location because it would be laborious to include all these details in the annual National Accounts Statistics (NAS). Information on GVO of Agriculture and related industries is provided in the current report for the years 2011–12 to 2019–20, both at current and constant (2010-11) prices.
Key Highlights:
- From 2011–12 to 2019–20, the output of the ‘livestock’ subsector increased steadily. In 2019–20, 66.5%, 23.3%, and 3.5% of the production of the livestock subsector was made up of milk, meat, and eggs, respectively, compared to 67.2%, 19.7%, and 3.4% in 2011-12.
- From 2011–12 to 2019–20, the output of the forestry and logging subsector increased. Industrial wood production increased from 74.3 billion to 124.4 billion rupees. In 2019–20, industrial wood, fuelwood, and NTFP produced around 63%, 23%, and 14% of the overall value of the forestry sector’s output, respectively, compared to 50%, 32%, and 18% in 2011-12.
- During 2011-12 to 2019-20, there has been a steady growth in the real output of fruits & vegetables’, which has increased from ₹ 287.4 thousand crore in 2011-12 to ₹ 383.3 thousand crore in 2019-20 at constant (2011-12) prices.
- In comparison to the output of pulses in 2011–12 (about 52 thousand crore), the output of “pulses” in 2019–20 was above 70 thousand crores. Together, Gram and Arhar produced close to 64% of the “pulses” group of crops’ total output in 2019–20.
- The output of the “fiber” group of crops decreased between 2011–12 & 2019–20, falling from approx. 82000 crores in 2011–12 to 81,000 crores in 2019–20 at constant prices.
- As a group, GVO of cereals, at ₹ 336.4 thousand crore, was highest among all the crop-groups in 2011-12. However, in 2019-20, GVO of ‘fruits and vegetables’ was ₹ 383.3 thousand crore, about ₹6 thousand crore higher than that of cereals.

