The issue of women’s representation in elected bodies came to the forefront yet again when a Women’s collective in Bengaluru launched a campaign to press for the passing of the Women’s Reservation bill in the parliament. Here is a look at the representation of Women in the Lok Sabha and how it has changed over the years.
The issue of women’s representation in elected bodies came to the forefront yet again when a Women’s collective in Bengaluru launched a campaign to press for the passing of the Women’s Reservation bill in the parliament. This, once again, brought forth the age-old debate of inadequacy of women in our elected bodies and whether there should be constitutional and legal safeguards for women in Parliament and state assemblies. The third- tier of elected bodies, the Panchayats, have already implemented 33% reservation for women. Apart from the fact that half the population is systemically excluded from political participation, representation and decision-making, what do the numbers tell us about women’s representation in Lok Sabha over the years?
Increase in Women MPs since the first Lok Sabha
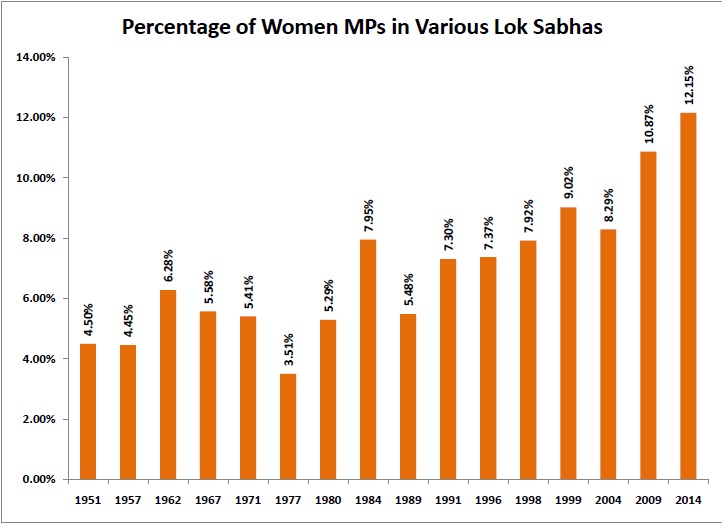
The first Lok Sabha in 1951 had 22 women MPs. The current Lok Sabha has 66. In the span of 54 years and 16 Lok Sabha elections it amounts to a three- fold increase in the number of women MPs that made their way to the lower house of the parliament. From 5% in 1951, women MPs constitute 12.2% of the Lok Sabha today. The rise in numbers has been steady through the years, both in absolute numbers and percentages. The notable exceptions have been the dip in numbers during the 6th Lok Sabha in 1977, the 9th Lok Sabha in 1989 and most recently the 14th Lok Sabha in 2004. The trends show a marked and steady increase from 1991 onwards to the present Lok Sabha. The 1991 figures show a jump from 5% in the previous Lok Sabha to 7% and the steady increase from thereon (except for 2004). It would be interesting to understand the factors for this watershed year and continuous rise and also the fall in numbers during 2004.
| S No | Year | Number of women MPs | Percentage of Women MPs |
|---|---|---|---|
| 1 | 1951 | 22 | 4.50% |
| 2 | 1957 | 22 | 4.45% |
| 3 | 1962 | 31 | 6.28% |
| 4 | 1967 | 29 | 5.58% |
| 5 | 1971 | 28 | 5.41% |
| 6 | 1977 | 19 | 3.51% |
| 7 | 1980 | 28 | 5.29% |
| 8 | 1984 | 43 | 7.95% |
| 9 | 1989 | 29 | 5.48% |
| 10 | 1991 | 39 | 7.30% |
| 11 | 1996 | 40 | 7.37% |
| 12 | 1998 | 43 | 7.92% |
| 13 | 1999 | 49 | 9.02% |
| 14 | 2004 | 45 | 8.29% |
| 15 | 2009 | 59 | 10.87% |
| 16 | 2014 | 66 | 12.15% |
The average representation of women MPs( 12.15%) is higher than the national average of women MLAs in state assemblies, which stands at a dismal 9%. While the numbers have increased over the years, the percentage of women that make up the Lok Sabha even today is not a figure to be proud of, especially when the ideal number should be at 33% at least. We still have a long way to go.
 Women contestants in elections to the Lok Sabha
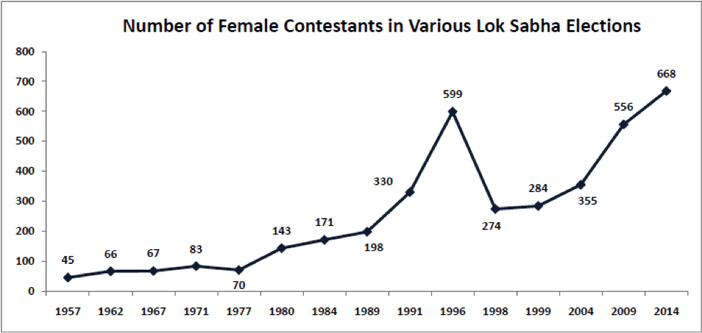
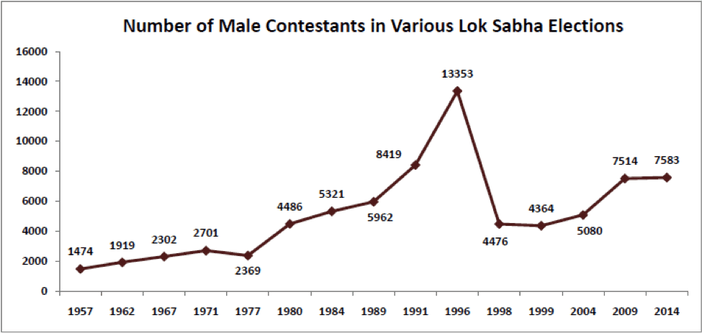
Central to the question of women’s representation in Lok Sabha is the appetite for women to take the political plunge and jump into the fray along with and against male candidates, getting tickets from their respective parties to contest elections and finally winning the seats that they contest. While popular perception might be that few women are willing to or have taken the political plunge, number of women contestants tells an interesting story. Between 1957(the earliest data available) and 2015, the total number of women contestants has increased from 45 to 668. That is a whopping 15 fold increase in the number of women contesting. If we looked at the data for male contestants for the same years, the number has increased from 1474 to 7583, a five- fold increase. The 15 fold increase in women contestants indicates towards the growing appetite for women to enter the political fray and willingness to be part of political decision-making.
 Success rate of Women Vs Men
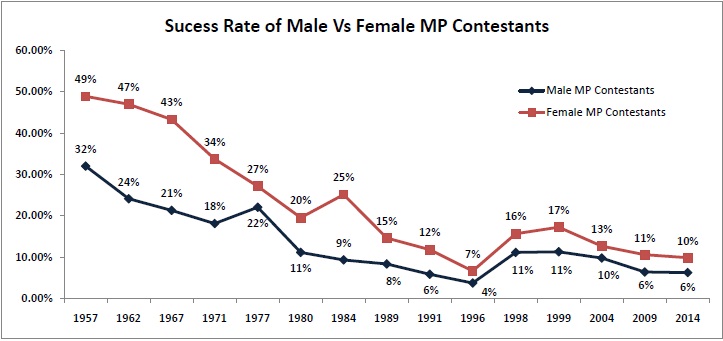
The other interesting story from the numbers over the years emerges from the relative success rate of women contestants as opposed to the male contestants. Consistently the success rate of women has been higher over the years than men. Success rate is the number of winners against the total contestants in that category. Women have had a greater success rate than Men in every single election. In some years, the difference has been quite stark. In 1971, the success rate for men was 18%, whereas it was 34% for women, which is twice that of men. For the current Lok Sabha, the success rate was 6.4% for men and 9.3% for women. This could mean one of the two things: Either women had a greater chance of winning from the seats that they stood from or that tickets were being given to women who had a greater chance of success. While numbers point towards a broad but important trend, it is fair not to be carried away by absolute conclusions, but to slice the data further and look at more granular data to establish causal relationships. While looking at women contestants currently, it would be fruitful to look at constituency level granularity of data to understand the profiles of women being given tickets within the context of entrenched patriarchal systems. What is the percentage of women who win come from political families and already nurtured constituencies as opposed to self-made women politicians?
 The above argument notwithstanding, it is important to understand that the rising numbers of women is an encouraging sign to pave the way for greater political participation of women. With the rise of new parties that don’t rely on political patronage of families, party systems and more importantly money and muscle power, greater number of women entering the political fray can only mean encouraging signs for decision making for a section that constitutes half the population. Now, if that were to be topped with a constitutional mandate to reserve 33% seats for women, then we are headed for more gender equal times. Else, it would be a case of two steps forward and one step backward!
Source: Data compiled by Factly team from the statistical reports of the Election Commission of India.


22 Comments
Very well written article. Wasn’t the government planning to pass an act regarding reservation of women at the MLA and MP level? What happened to that?
Aayush: The Women’s Reservation Bill 2008 has been pending in the parliament. One party or the other opposes it. It has not seen the light of the day yet.
Many thanks for the kind words, Ayush! Over the coming week, we’ll do a data driven write up on the women’s reservation bill.
put a graph which shows number of party workers too. women cant be a privilege class, thy cant have power without responsiblity. this is misandry
We would love to if the political parties subject themselves to Right to Information and keep sharing such data.
oh ya,u find all crazy statistics ,but ur investigative journalism cant find how many women are there in RSS ,how many are there as AAP volunteers ,how many are there in youth congress….u dont require an RTI to confirm the fact tht women are not there in grass root politics .Just believe ur own eyes during election campaign on every election .
What does the current data that we presented here tell you? That women are a privelged class? Then my friend, you’ve understood the data entirely wrong. While I think what you propose is an interesting idea to make some comparisons. However, in this case we are talking political representation.
i have understood the data correctly .u are showing only one side of the story. u are sayin 1+1 = 2 .but fail to show 3-1 is also 2 . how conveniently u played the victim card wen u say “women are a privileged class” i never said tht. all i am sayin is this is selective reporting .can i conclude tht women politicians are cruel just becaz we had emergency under indira…can i conclude women politicians are corrupt just becaz we have mayawati building her own statue like hitler and stalin ,or wen we have traitor like mamatha who allow bangladeshi to cross the border or wen we have jaya who is convicted for corruption. now if i do conclude tht means i am doing selective data analysis like u have done.
‘women cant be a privilege class’ Your words, not mine. And how is saying that women are underrepresented playing the victim card, when the data is clearly showing so. I’d like to hear your 3-1=2, perspective from this data. I clearly made a point that beyond the visible data, we need to look at granularity and establish causal realtionships to understood why women are under represented.Surely 11% isn’t a figure to be proud of. Saudi Arabia has 19% women in their parl.
And no, if lalu Prasad, NCBN, A raja et al doesn’t mean that all male politicians are corrupt, then the assertions you make about select women politicians stand on shifting sands. Anyway the point is not about individuals but categories within the population. from your point above i am inclined to understand that women at the grassroots work less hard than men do. and so women don’t have a right to reach at the top. If that is what you imply, then you must research on the many structural difficulties women face at the grassroots. read this testimony of a woman grassroots worker in Bihar and that gives you an idea of the barriers women face. When asking for equality, there has to be a lvel playing field also.
I am trying very hard to see your point, believe me I am..But it is near impossible unless you do away with whataboutery and talk rationally. As this website is all about data. make your point with data.
are u suggesting if more women are there ,it is progressive .WELL U ARE WRONG.western world is surviving becaz of sweat and blood of their forefathers ,maintaining a strong currency by controlling oil and through constant immigration .btw even in usa congress, women representation is not tht gr8. all throughout the article ,u r classifying every damn thing as men and women.but u never cared to bring a stat on women working in grass root level.ATLEAST BRING A STAT ON WOMEN WHO CONTESTED INDEPENDENTLY . affirmative action is meaningless and dangerous. and in tht sense i said women are a privilege class. it makes men as a gender group , second class citizen . STATE CANT ACT AS FATHER/HUSBAND/PROTECTOR . i have lived in western countries and i can tell u with facts tht western civilization is FAILING only and only becaz men (white men) are treated as second class. just watch the demographic changes in last 20 yrs ,if the tread continues western civilization as we know it today will cease to exist. .i am all ok with social changes but it has to be based on equality and gender neutral.LET WOMEN WORK IN GRASS ROOT LEVEL u will naturally get independent leader who will be more effective.OTHERWISE IT WILL BE LIKE SC/ST QUOTA where a few will enjoy the privileges .
Pingback: Open data for International Women’s Day: Making data work to bridge the gap in women’s political representation | Badili
Pingback: Number of Women MPs in Lok Sabha Since Independance.
Pingback: The Dialogue | Women MPs in Lok Sabha: How have the numbers changed?
Pingback: What Is Gender Inequality?
Pingback: Women’s Representation in Politics = Holistic Socio-Economic Development | Gender Matters | India
Pingback: Women MPs in Lok Sabha: How have the numbers changed? – Gender and Politics
Please check the data; first LS was in 1952 (not 1951)! And check the number of women returned in 2014 LS elections (which is a bit different from what is the situation now in the same LS).
Pingback: We Desperately Need More Women In Parliament—But It Will Take A Social Revolution | digg18
Bhanupriya, as an activist and an academic I have been involved in a few studies related to women’s participation in governance bodies as is my current PhD work. I hence find the analysis interesting. The obstacles in passing the WRB reflect a real flip-flop across party positions and also shifting stands of the women’s movement. It also raise the question as to how uniformly and consistently committed the parties are in seeing to the passage of the Bill. It would be useful to analyze the Lok Sabha debates from a gender, caste and party perspective to pinpoint where the resistance lies — part of the ‘granular’ analysis that you have rightly suggested. Look forward to more write-ups from you.
regards,
Mani
Pingback: Young women turn out in large numbers to vote – and parties are finally taking note – Namastey Nation
Pingback: Women and Political Participation in India | Safecity
Pingback: CAREER IN POLITICS: PARENTS MUST CONSIDER FOR DAUGHTER. – Words With The Wandering Soul