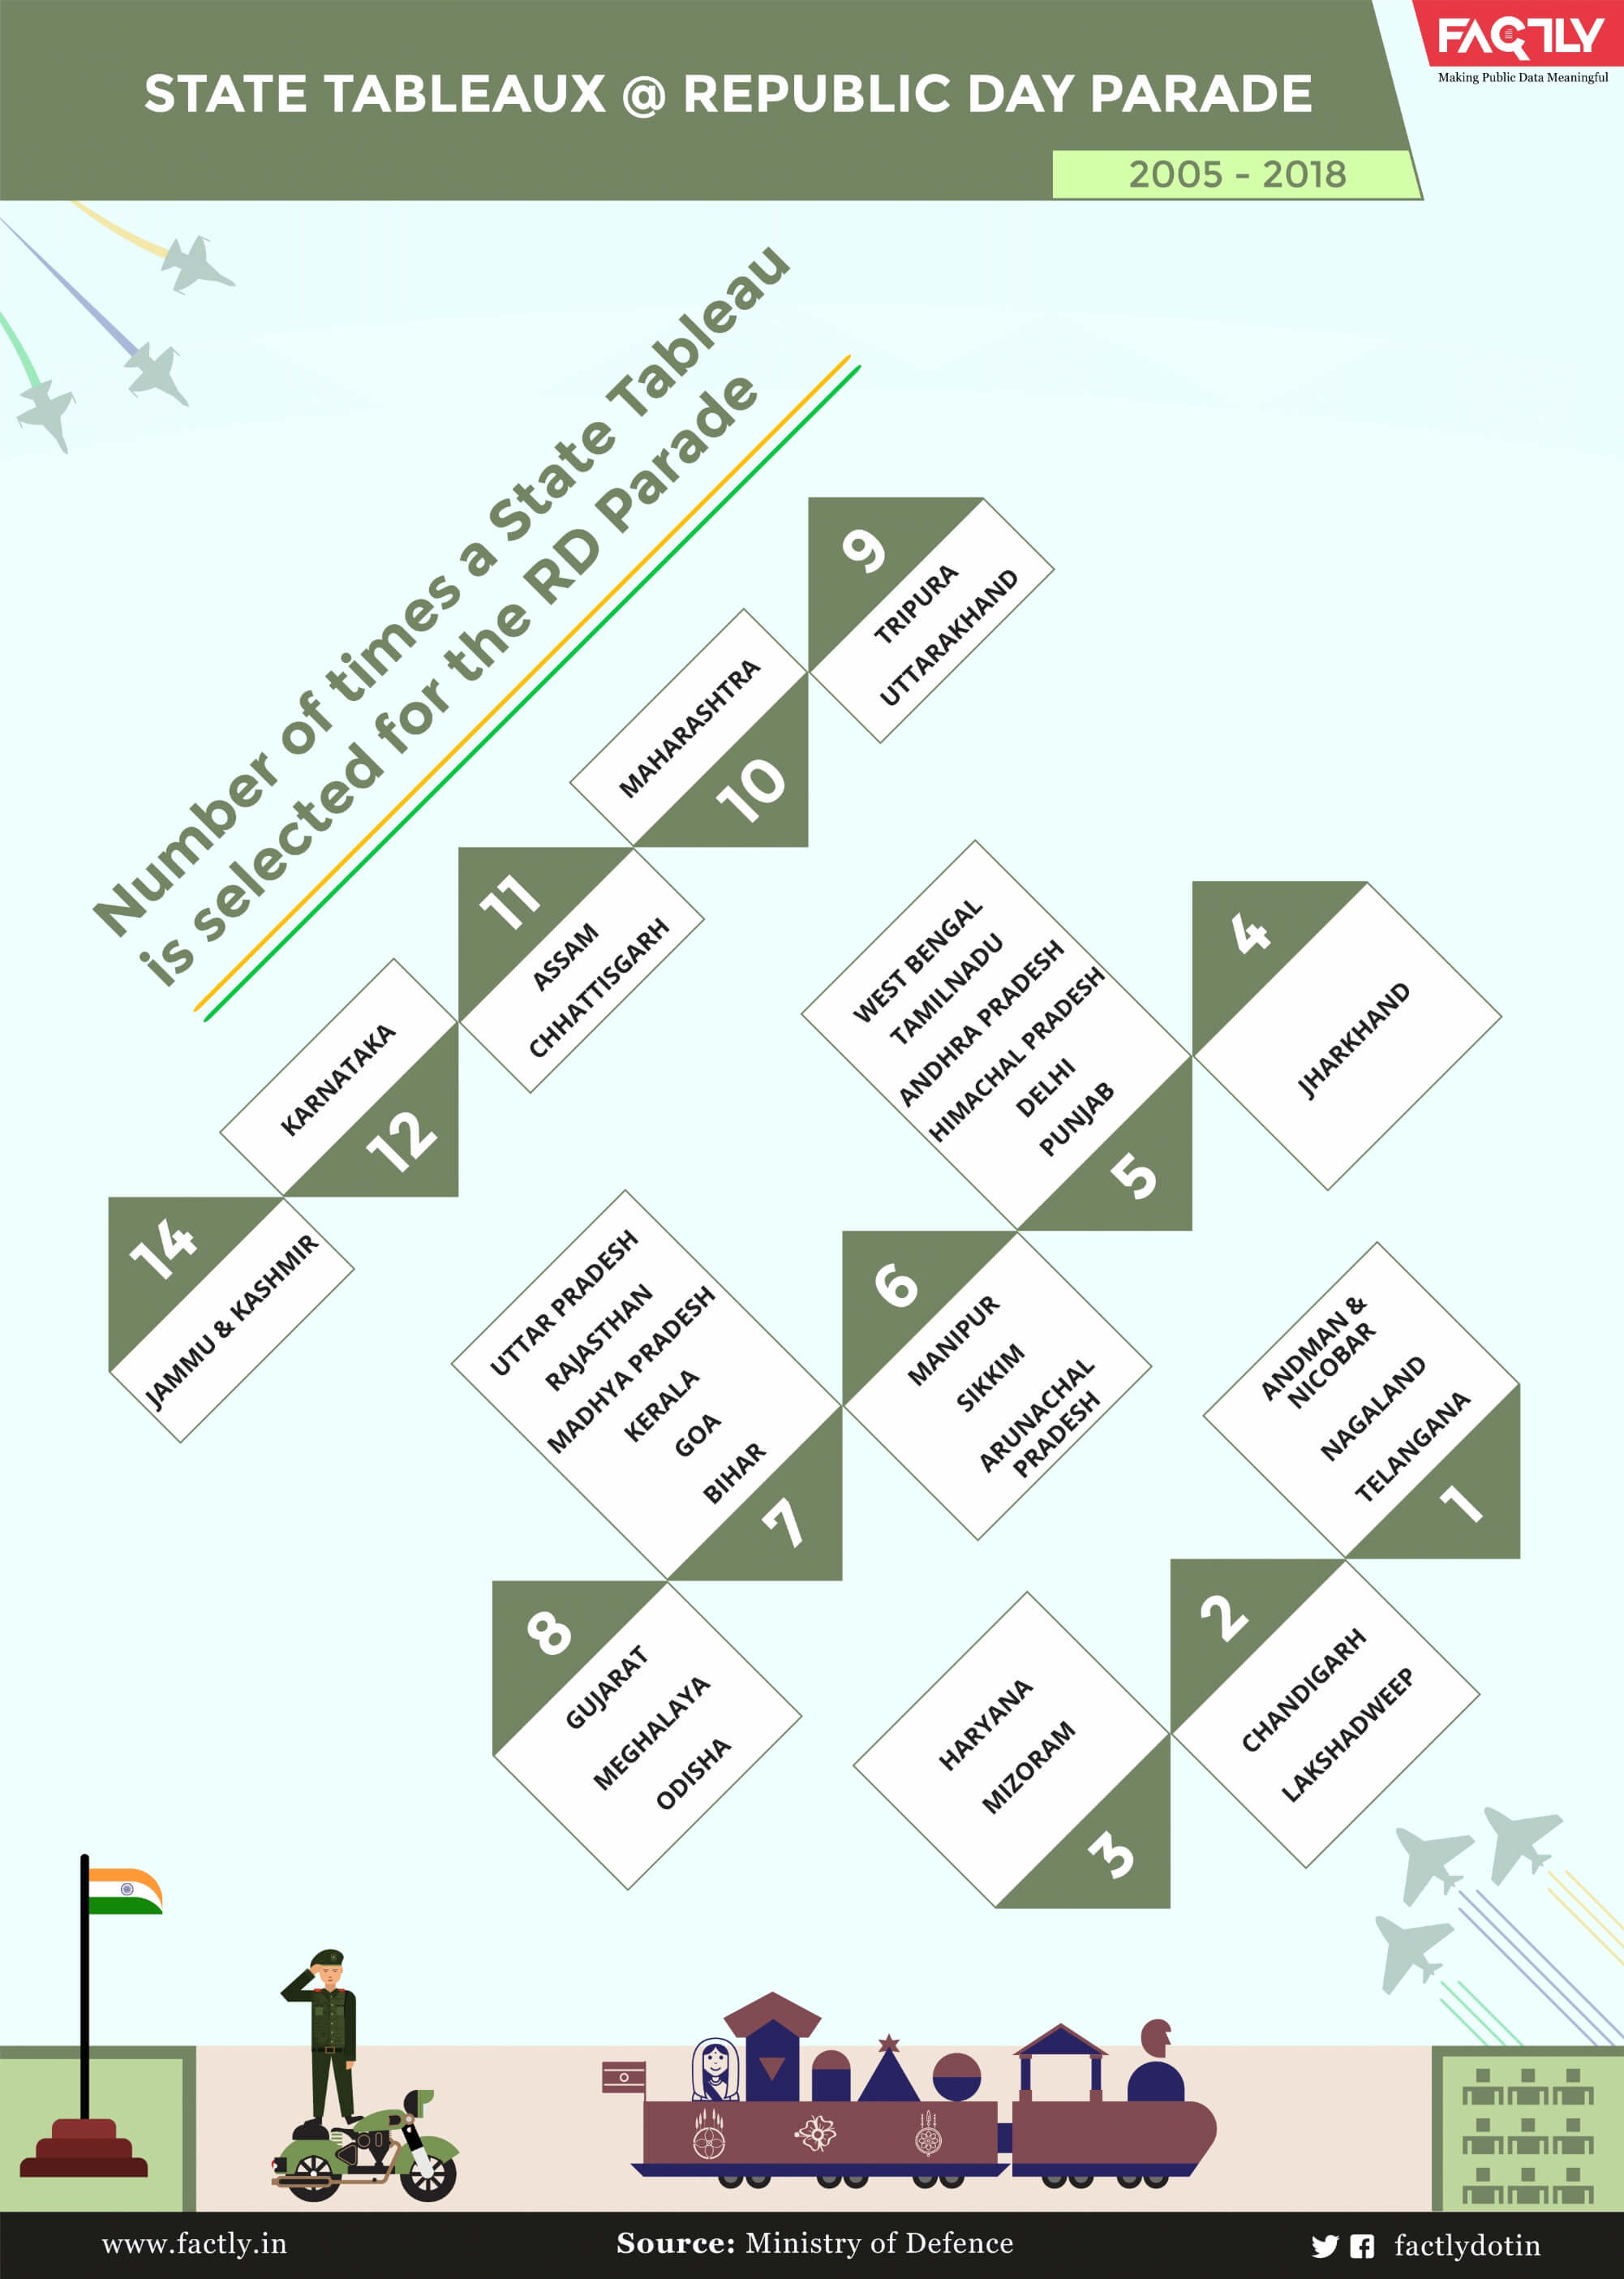
[orc]The Republic Day (RD) Parade in Delhi is a spectacle that one cannot miss. Tableaux selected for the RD parade offer a unique opportunity to witness the culture,heritage & other unique aspects of various states. As per data shared by the Ministry of Defence, Jammu & Kashmir is the only state whose tableau was selected for every RD parade since 2005. Culture & Heritage was the theme for majority of the tableaux in the last 14 years.
Selection of a state Tableau for the RD parade is considered prestigious. In the last 14 years (2005 to 2018), an average of 15 tableaux were selected per year out of close to 30 proposals received every year. Factly obtained data from the Ministry of Defence about the tableaux selected each year since 2005 and here is what the data has to say.
Who selects the Tableaux for the RD parade?
As per the response received from the Ministry of Defence (MoD), ‘Tableau proposals received from various states/UTs are evaluated in a series of meetings of an expert committee consisting of eminent persons in the field of art, culture, painting, sculpture, music, architecture, choreography etc. The expert committee examines the proposals on the basis of theme, concept, design and visual impact before making its recommendations’.
Jammu & Kashmir is the only state whose Tableau was part of every RD parade since 2005
The data obtained from the MoD shows that a total of 207 tableaux were selected for the RD parade from 2005 to 2018. Jammu & Kashmir is the only state whose tableau was selected for the parade every year (14 times). Next in line is Karnataka whose tableau was selected 12 times during the 14 year period. The tableaux of Assam & Chhattisgarh were selected 11 times each.

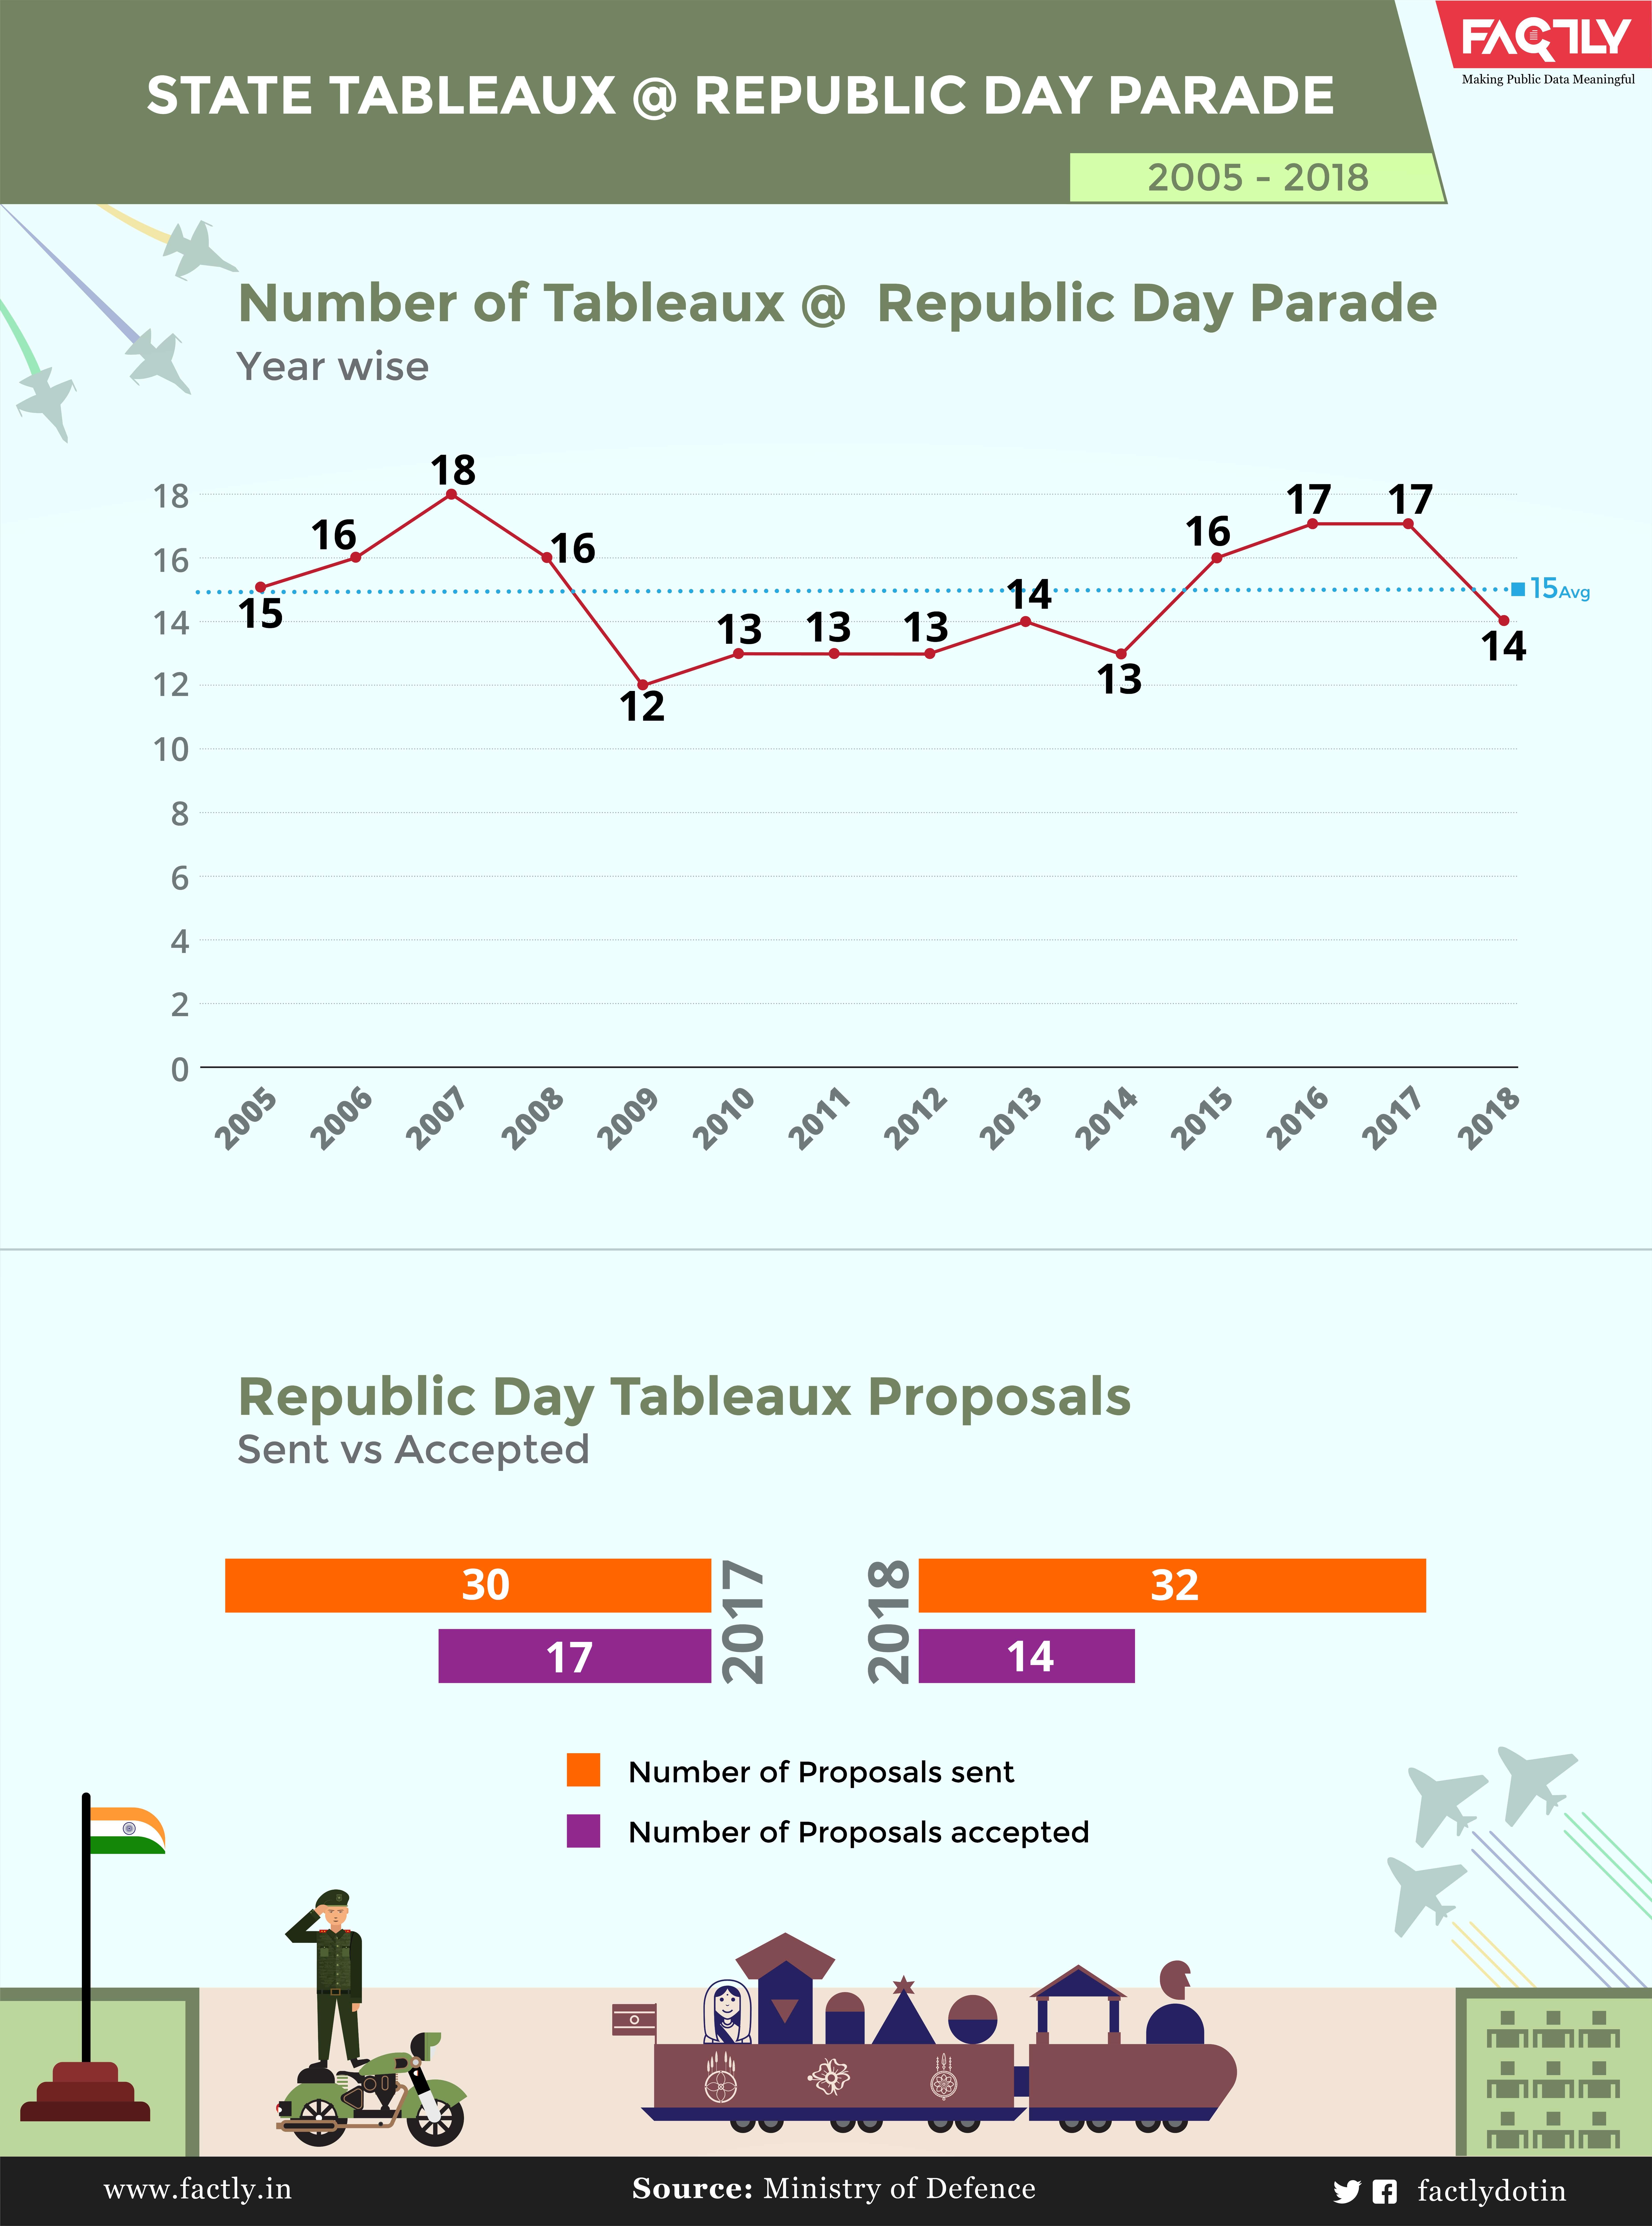
Most Tableaux were selected in 2007
The data also shows that the most number of tableaux for the parade were selected in 2007, when 18 tableaux were selected. In the year 2009, only 12 tableaux were selected, the lowest for any year. On average, 15 tableaux were selected each year. In terms of the acceptance rate, 17 of the 30 proposals were accepted in 2017 while only 14 out of the 32 proposals were accepted in 2018.

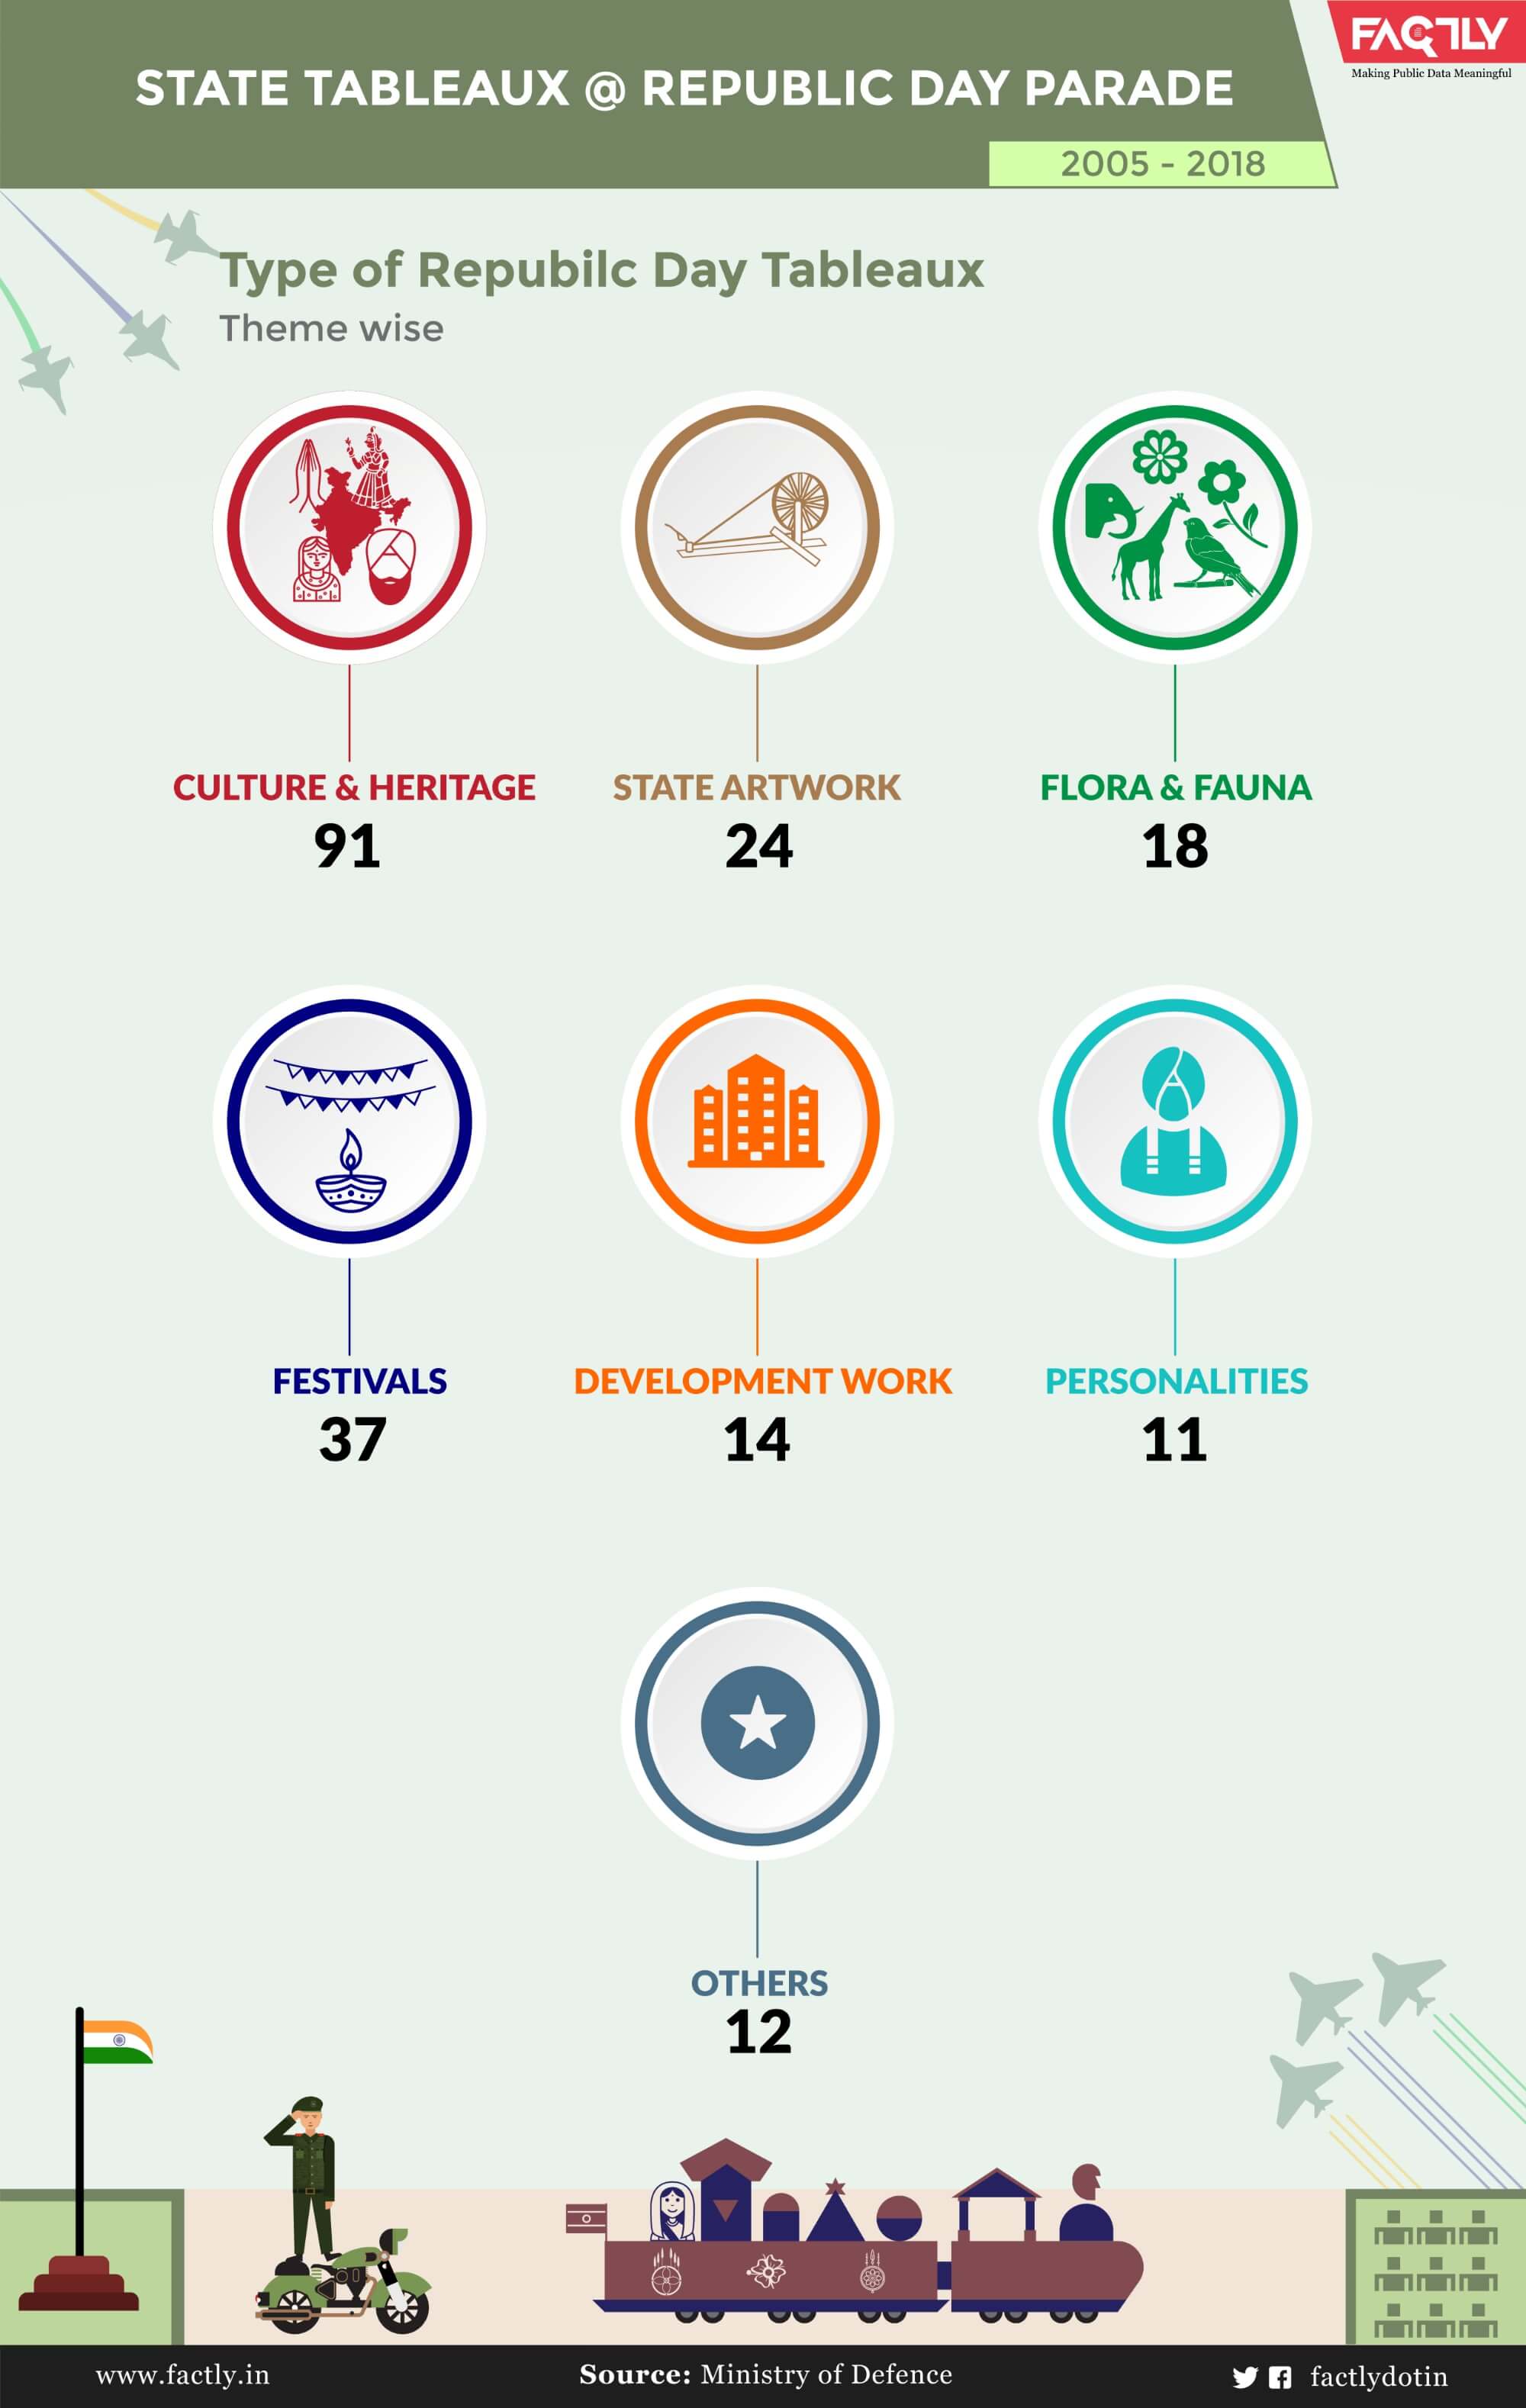
Most Tableaux had Culture & Heritage as the theme
In terms of themes, 91 tableaux had a theme depicting culture & heritage while 37 of them depicted various festivals, 24 of them depicted the artwork and art forms of respective states while 18 of them depicted the flora & fauna of the states. Eleven (11) tableaux depicted personalities while 14 of them showcased development work in their states.

Infographic Design by Uday Erothu


1 Comment
Awesome. Thank you.