In the recent Rajasthan Assembly elections, 13 independents won and prevented Congress from securing a majority on its own. But such a large number of independents winning in an assembly elections is becoming a rarity. In the Lok Sabha elections, their role is all but over. Here is a look at the numbers related to independent candidates in the various Lok Sabha elections
In the recent Rajasthan Assembly elections, 13 independents won and prevented Congress from securing a majority on its own. But such a large number of independents winning in an assembly elections is becoming a rarity. In the Lok Sabha elections, their role is all but over. Here is a look at the numbers related to independent candidates in the various Lok Sabha elections
Number of Independents contesting increasing over the years
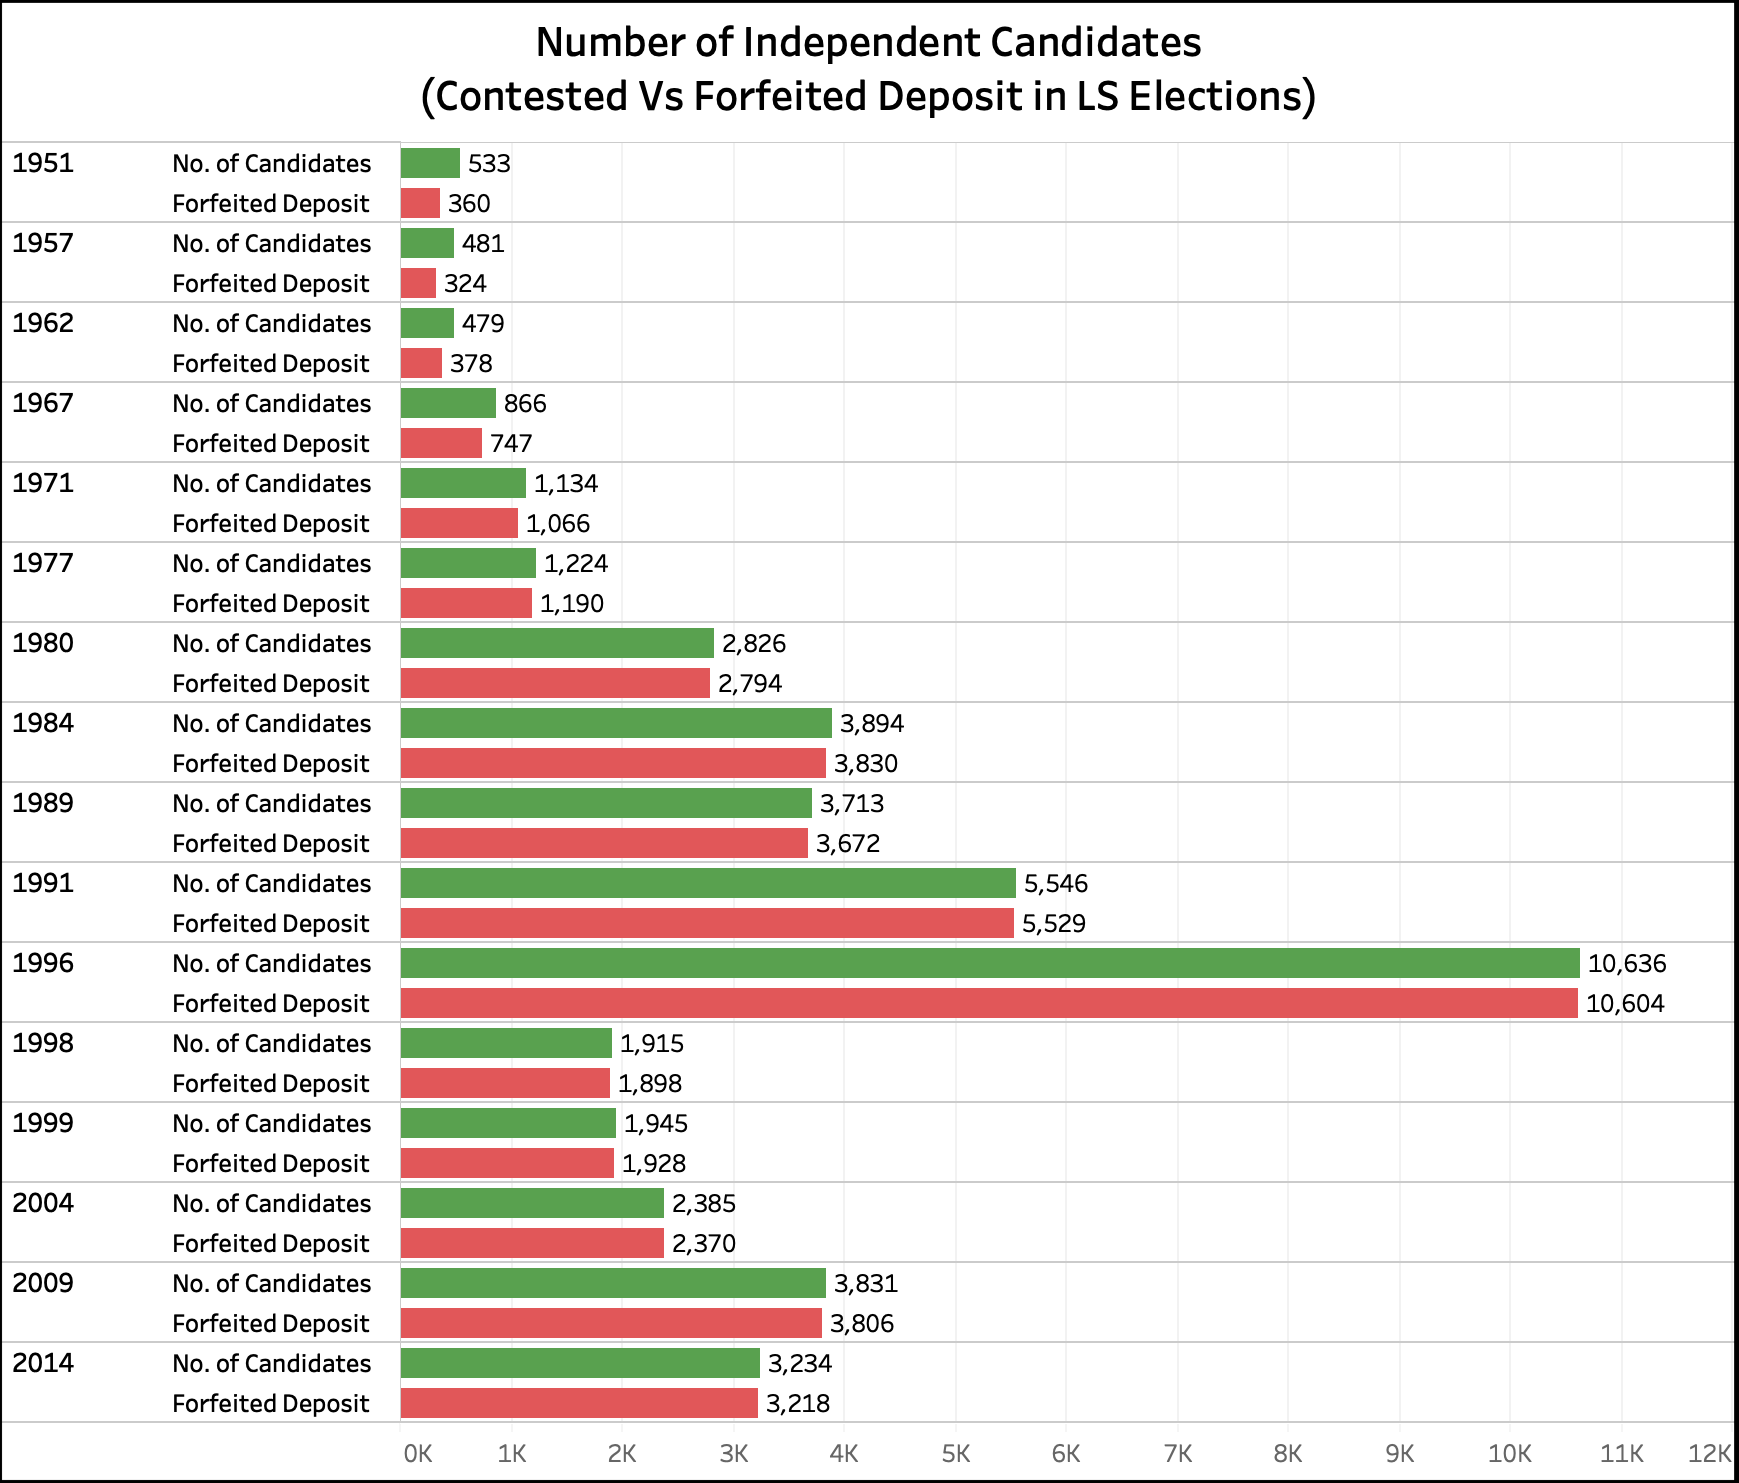
The number of independents contesting the Lok Sabha elections has steadily increased starting from the first general election in 1951. In 2014, a total of 3234 independents contested the election. An overwhelming number of these independents forfeit their deposits every election. In 2014, 99.5% of these 3234 candidates forfeited their deposits. From 1951 to 2014, a total of 97.92% of the independent candidates forfeited their deposits adding credence to the charge that a large number of these candidates are non-serious candidates.
| Year | Number of Independent Candidates | Number of Independent Candidates who forfeited their deposit | Percentage of Independent candidates who forfeited their deposit |
|---|---|---|---|
| 1951 | 533 | 360 | 67.54% |
| 1957 | 481 | 324 | 67.36% |
| 1962 | 479 | 378 | 78.91% |
| 1967 | 866 | 747 | 86.26% |
| 1971 | 1134 | 1066 | 94.00% |
| 1977 | 1224 | 1190 | 97.22% |
| 1980 | 2826 | 2794 | 98.87% |
| 1984 | 3894 | 3830 | 98.36% |
| 1989 | 3713 | 3672 | 98.90% |
| 1991 | 5546 | 5529 | 99.69% |
| 1996 | 10636 | 10604 | 99.70% |
| 1998 | 1915 | 1898 | 99.11% |
| 1999 | 1945 | 1928 | 99.13% |
| 2004 | 2385 | 2370 | 99.37% |
| 2009 | 3831 | 3806 | 99.35% |
| 2014 | 3234 | 3218 | 99.51% |

(Any candidate who secures less than 1/6th of the total valid votes polled in a constituency will forfeit the security deposit paid)
Independent Candidates & Success Rate
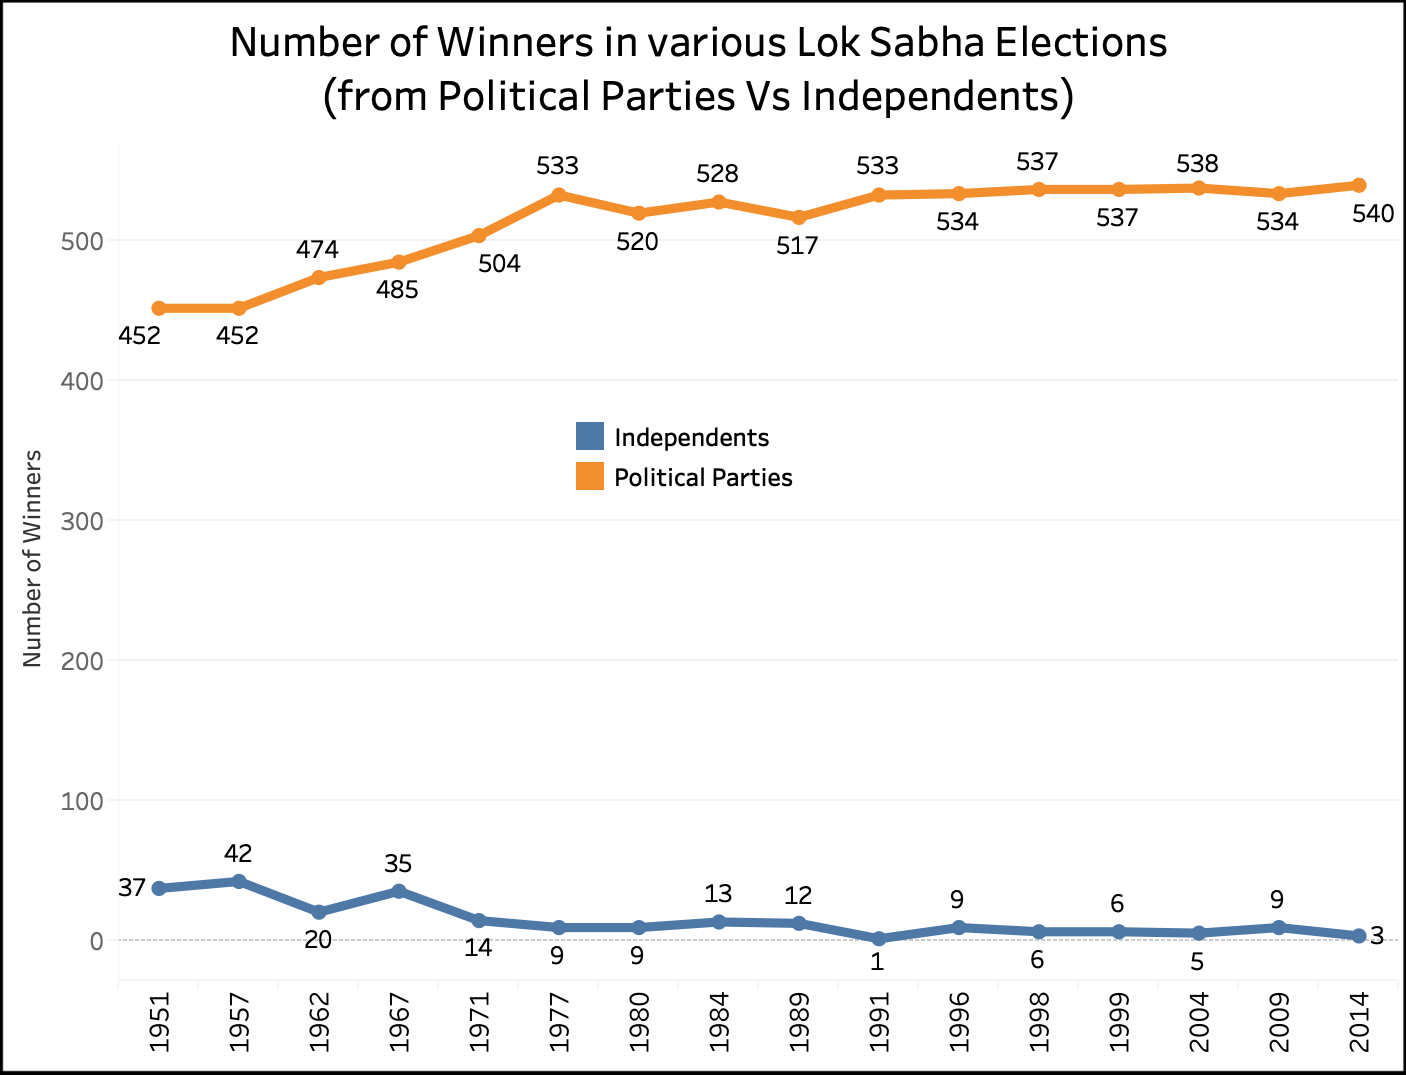
The ability of independent candidates to win an election always had a question mark and the numbers don’t prove otherwise. More than 30 independents won in each of the 1951, 1957 and 1967 Lok Sabha Elections. Their numbers have been decreasing ever since. This number hasn’t reached double digits after the 1989 Lok Sabha elections.
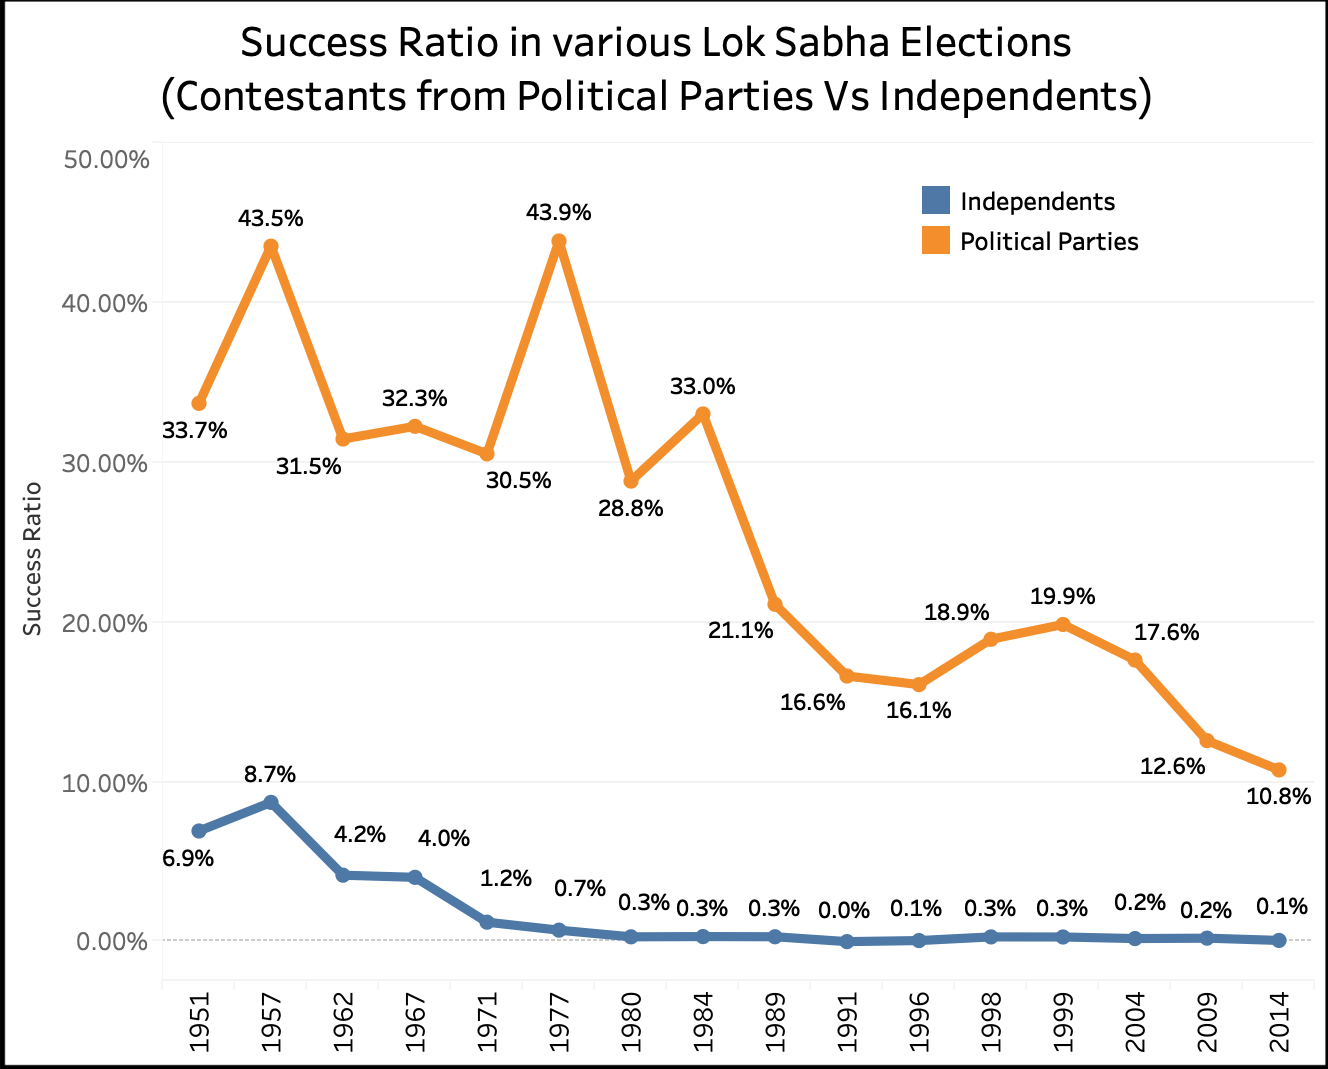
| Year | Total No of Contestants | Total Number of seats | Number of Independent Candidates | Number of Winners from Independents | Success Rate of Candidates from Political Parties | Success Rate of Independent Candidates |
|---|---|---|---|---|---|---|
| 1951 | 1874 | 489 | 533 | 37 | 33.7% | 6.9% |
| 1957 | 1519 | 494 | 481 | 42 | 43.5% | 8.7% |
| 1962 | 1985 | 494 | 479 | 20 | 31.5% | 4.2% |
| 1967 | 2369 | 520 | 866 | 35 | 32.3% | 4.0% |
| 1971 | 2784 | 518 | 1134 | 14 | 30.5% | 1.2% |
| 1977 | 2439 | 542 | 1224 | 9 | 43.9% | 0.7% |
| 1980 | 4629 | 529 | 2826 | 9 | 28.8% | 0.3% |
| 1984 | 5492 | 541 | 3894 | 13 | 33.0% | 0.3% |
| 1989 | 6160 | 529 | 3713 | 12 | 21.1% | 0.3% |
| 1991 | 8749 | 534 | 5546 | 1 | 16.6% | 0.0% |
| 1996 | 13952 | 543 | 10636 | 9 | 16.1% | 0.1% |
| 1998 | 4750 | 543 | 1915 | 6 | 18.9% | 0.3% |
| 1999 | 4648 | 543 | 1945 | 6 | 19.9% | 0.3% |
| 2004 | 5435 | 543 | 2385 | 5 | 17.6% | 0.2% |
| 2009 | 8070 | 543 | 3831 | 9 | 12.6% | 0.2% |
| 2014 | 8251 | 543 | 3234 | 3 | 10.8% | 0.1% |

The increase in the number of independent and the decrease in the number of winners resulted in a dismal success rate for independents (Number of winners/Number of contestants). Their highest success rate was in 1957 when 8.7% of the independents won the election. In all the General elections since 1951, independent candidates could win only 3% of the total seats and their success rate has been a mere 0.5%.
 Independent Candidates & Vote Share
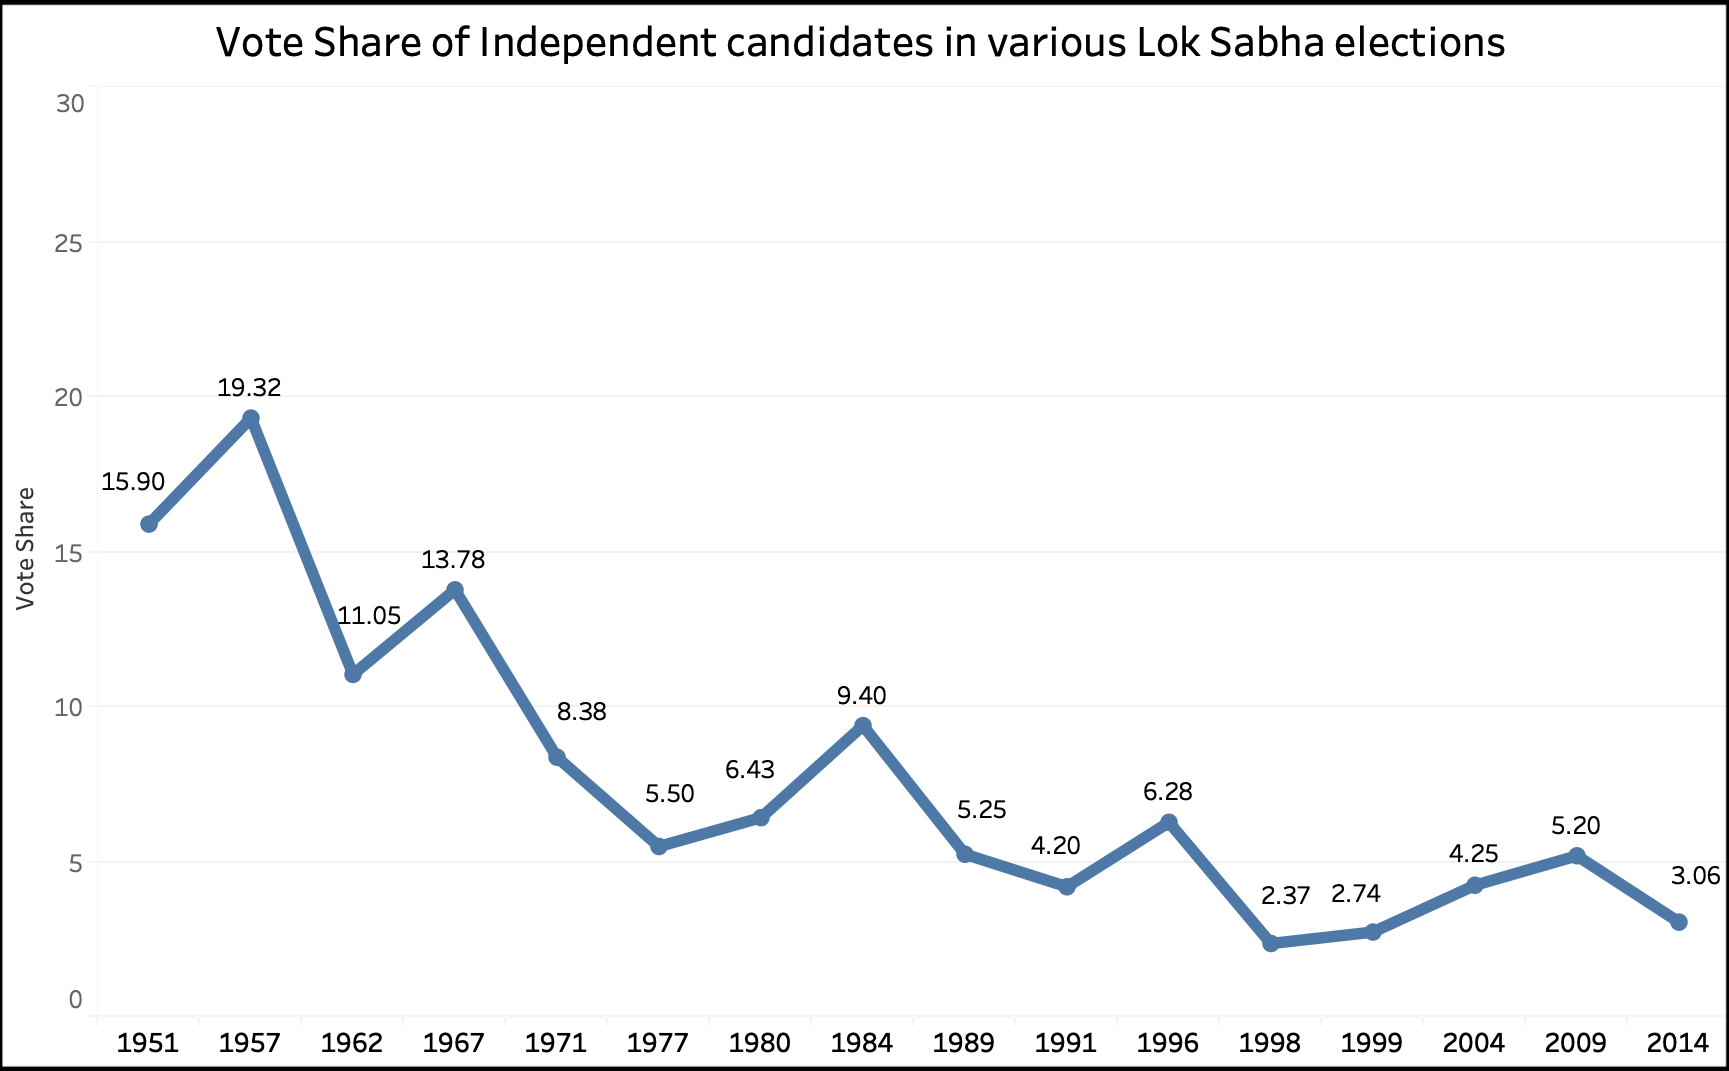
Independent Candidates polled more than 10% of the total valid vote in each of the first four general elections. After that, their vote percentage saw a steady decline and in 2014, they polled just 3% of the total vote.
| Year | Vote Percentage of Candidates from Political Parties | Vote Percentage of Independents |
|---|---|---|
| 1951 | 84.1 | 15.9 |
| 1957 | 80.68 | 19.32 |
| 1962 | 88.95 | 11.05 |
| 1967 | 86.22 | 13.78 |
| 1971 | 91.62 | 8.38 |
| 1977 | 94.5 | 5.5 |
| 1980 | 93.57 | 6.43 |
| 1984 | 90.6 | 9.4 |
| 1989 | 94.75 | 5.25 |
| 1991 | 95.8 | 4.2 |
| 1996 | 93.72 | 6.28 |
| 1998 | 97.63 | 2.37 |
| 1999 | 97.26 | 2.74 |
| 2004 | 95.75 | 4.25 |
| 2009 | 94.8 | 5.2 |
| 2014 | 96.94 | 3.06 |
 What is it difficult for Independents now?
Local leaders or those who fought for local issues (with no political affiliation) had a good chance to win in the early years after independence. With time, the influence of money & political party have become more dominant compared to the years after independence. Today, a Lok Sabha constituency has an electorate of 15-20 lakh voters on average, spread across 7 odd assembly constituencies. To campaign & influence such a large population & geography requires both money & influence. Increasingly, only rich candidates with political backing are making the cut. While independents still win Assembly seats, their numbers are also decreasing in the assemblies. All in all, the influence & the role of independents in Lok Sabha elections has greatly diminished over the years.
What did the Law Commission Recommend?
Looking at the above numbers, it does look like the Law Commission got its recommendation right when it said that independents be debarred from contesting elections since it is not difficult to register a political party. In its 255th Report on Electoral Reforms, the Law Commission recommended that independent candidates be barred from contesting in Parliament & Assembly elections and that Section 4, Section 5 of the Representation of People’s Act be amended accordingly.
Even the 170th Law Commission report in 1999 had recommended debarring the independent candidates from contesting in elections. The reasons for these recommendations are manifold. The NCRWC (The National Commission to Review the Working of the Constitution) recommended the “discouragement” of independent candidates, who are often “dummy” candidates or defectors from their party or those denied party tickets. It is also argued that independent candidates are non-serious candidates with very little chance of winning. In the recent times, the practice of independent candidates with the same name as candidates from recognized political parties contesting elections to create confusion among voters, has increased.
The situation for truly independent candidates is not going to change unless there are accompanying electoral reforms that promise a level playing field along with checks & balances to prevent the non-serious candidates from contesting the election.


