[orc]India’s trade balance has been negative for most years. While Services dominate India’s exports, Petroleum makes up for a large portion of India’s imports. Here is a detailed look at India’s export & import story.
India’s trade balance, since independence has mostly been in deficit i.e. the value of imports exceeds the value of exports. Over the years, this difference has progressively widened barring few occasions where the defect had seen a declining trend.
The last two years (2017-18 & 2018-19) has seen an increase in the trade deficit post a phase of 4 years (2013-17) where in the deficit was on the decline. As observed in an earlier story by Factly, the trade deficit is the major contributor towards the deficit in the current account of India’s Balance of Payments.
What are the components that cause this deficit in India’s Trade Balance? In this story we explore the various exports and imports of India and their trends.
Surplus in trade of services is due to the higher exports in Software services
In the earlier story, we have highlighted that the deficit in the trade balance is due to the deficit balance in trade of goods, while trade of services is in surplus.
As per the data released by RBI in the ‘Handbook of Statistics on Indian Economy’, over the past decade, the value of exports of services is more than the value of import of services. Furthermore, the surplus is in an increasing trend over the decade. Import of services valued at ₹ 2,834 billion in 2009-10 have increased to ₹ 8,825 billion in 2018-19. During the same period the exports in services increased from ₹ 4,546 billion to ₹14,563 billion, thus widening the surplus in service trade.
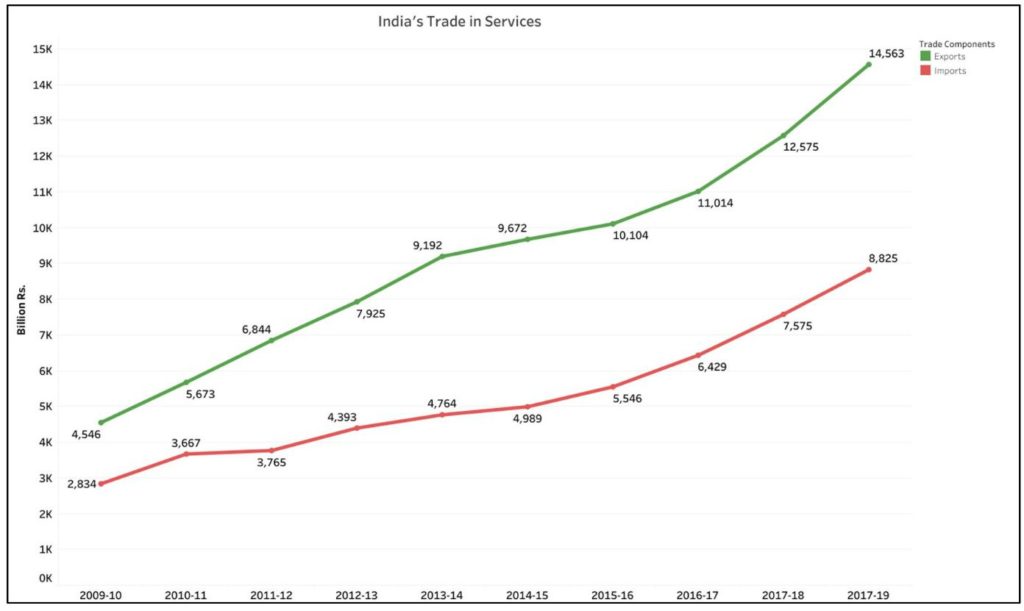
In spite of the increase in imports, the corresponding increase in exports have ensured that the trade in services has a surplus all through the past 10 years. However, not all services have a surplus. The surplus in the trade in services is largely due to the surplus of software services.
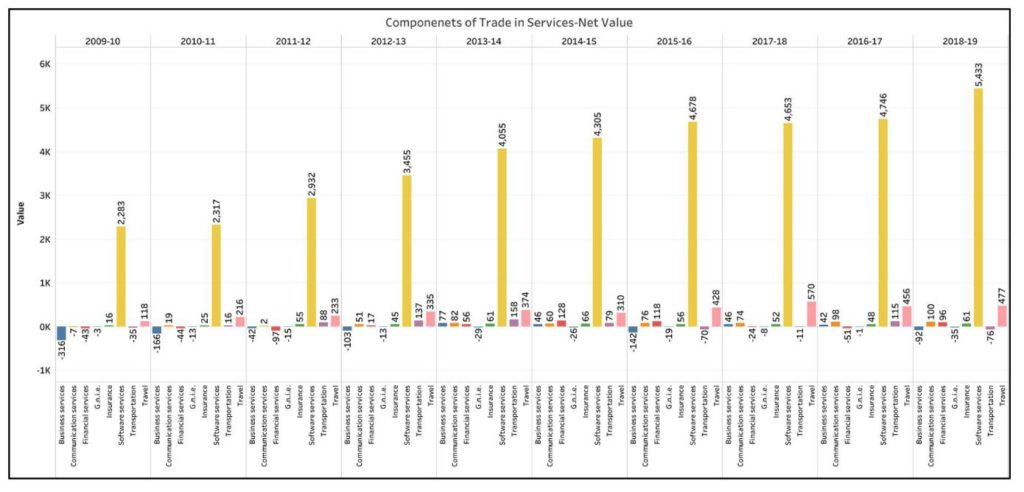
Software services constitute the major share in the overall volume of trade in services. In the year 2009-10, the exports in software amounted to ₹ 2,353 billion while the imports were only ₹ 70 billion, contributing a surplus to the tune of ₹2,283 billion. In the year 2018-19, the value of import of software services increased to ₹ 405 billion, while the exports increased to ₹ 5,839 billion leaving a surplus of ₹ 5,433 billion.
Business services and Travel are the next largest components. The net value of trade in business services has been in a deficit during 2009-13 and then moving into surplus (2013-17, barring 2015-16) and then recording a deficit of ₹ 92 billion in 2018-19. Financial services and Transportation services have also had inconsistent net value of trade over the past 10 years.
On the other hand, Travel services has recorded a consistent growth in the surplus of trade. In the year 2009-10, the value of imports in Travel services was ₹ 442 billion and that of exports was ₹ 560 billion i.e. surplus of ₹ 118 billion. After a consistent increase over the years, in 2018-19, the value of exports is ₹ 1,991 billion with a surplus of ₹ 477 billion.
Engineering goods, Petroleum Products, Gems & Jewellery among the highest value export commodities.
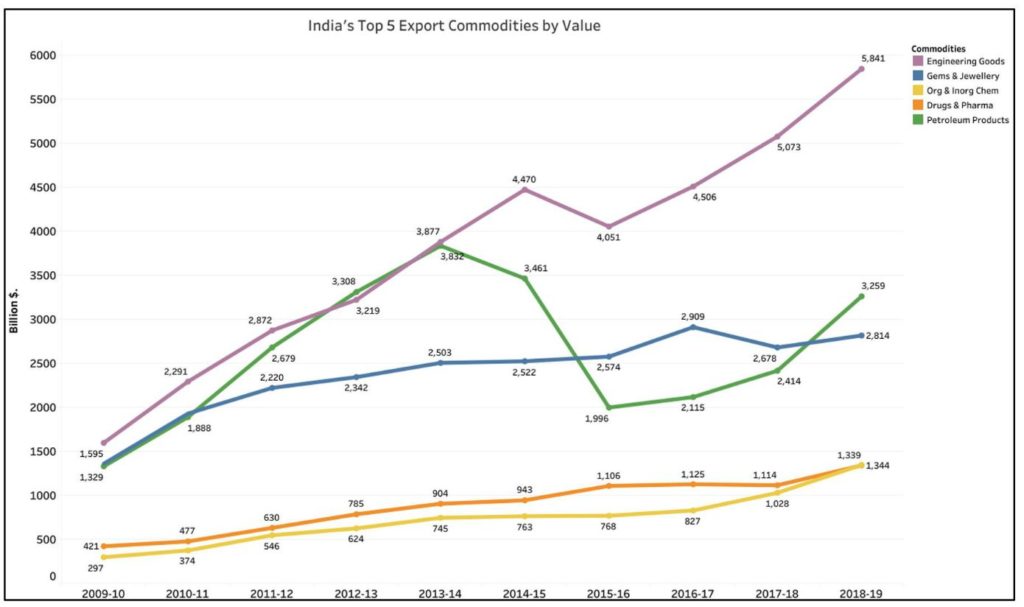
Among the different commodities exported by India, Engineering Goods have the highest value. Along with having the highest gross value, they are also the commodity with the highest growth over the past decade. Except for a blip in 2015-16, the total exports of Engineering goods have increased every year. In 2009-10, Exports of Engineering goods were valued at ₹1,595 billion which increased by more than 3.6 times and in the year 2018-19 are valued at ₹ 5,841 billion.
Exports of Petroleum products rank second and valued at ₹ 3,259 billion in 2018-19. During the year 2013-14, they reached their highest positive over the decade at ₹ 3,832 billion. After a sharp decline over next two years, they started with their recovery in 2016-17.
Export of Gems & Jewellery has shown a steady and consistent increase and are currently the third highest valued exports at ₹ 2814 billion in 2018-19.
Organic & Inorganic Chemicals and Drug & Pharma complete the list of top five export commodities of India.
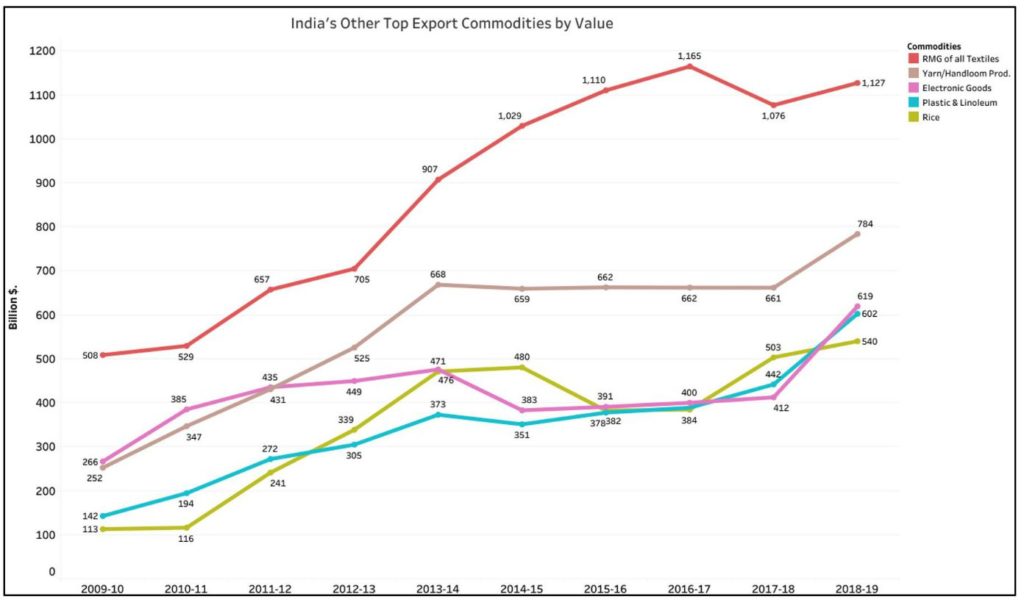
Among other top exports, export of RMG (Ready Made Garments) have more than doubled over the past 10 years. However, the highest was in year 2016-17. The exports have increased last year after a fall in the previous year.
After a near flat growth in exports during 2014-18, the value of exports in Yarn & Handloom products have increased in 2018-19 with ₹784 billion. Plastic & Linoleum products have seen a consistent increase in the exports over the decade.
Rice and Electronic goods are among the top 10 exported commodities and the growth in value of these exports have varied over the years.
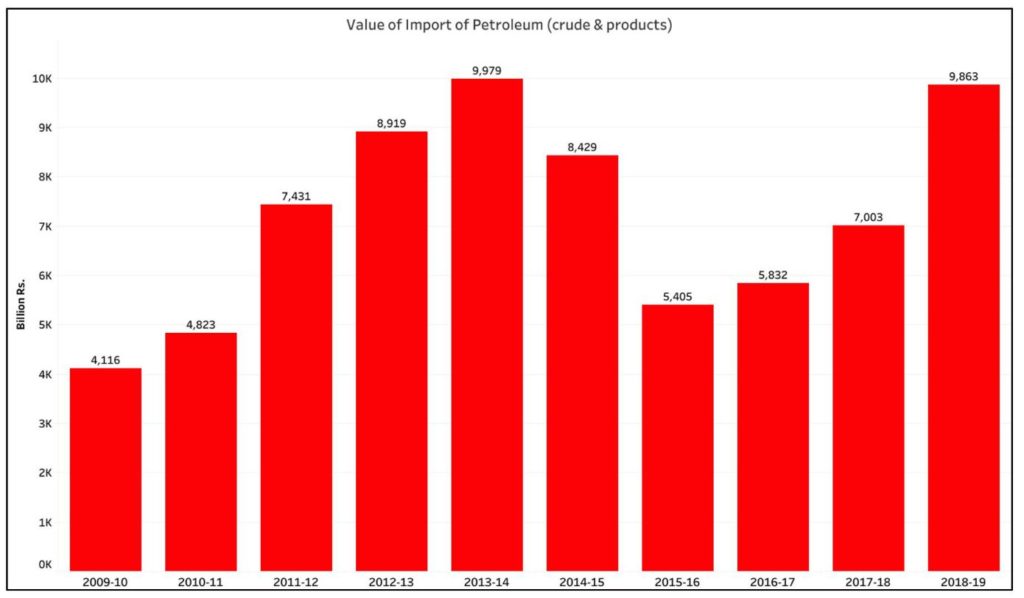
Petroleum (Crude & Products) account for a substantial portion of imports in India
A decade back i.e. in 2009-10, Petroleum (crude & products) imports were valued at ₹ 4,116 billion which constituted around 30.2% of the total Imports.
The import value of this commodity has consistently increased over the years with it valued at ₹ 9,862 billion in 2018-19. Petroleum (crude & products) has occupied a major share of the total imports all through the previous decade but the proportion has varied during this time. In 2013-14, it reached the highest point with a share of 36.7 % of the total imports of India. During that year, the value of Petroleum imported was ₹ 9,978 billion. In the subsequent years, the value of Petroleum based imports has come down in value which also resulted in the fall of its share. However, the last two years has seen an increase in the total volume of petroleum being imported.
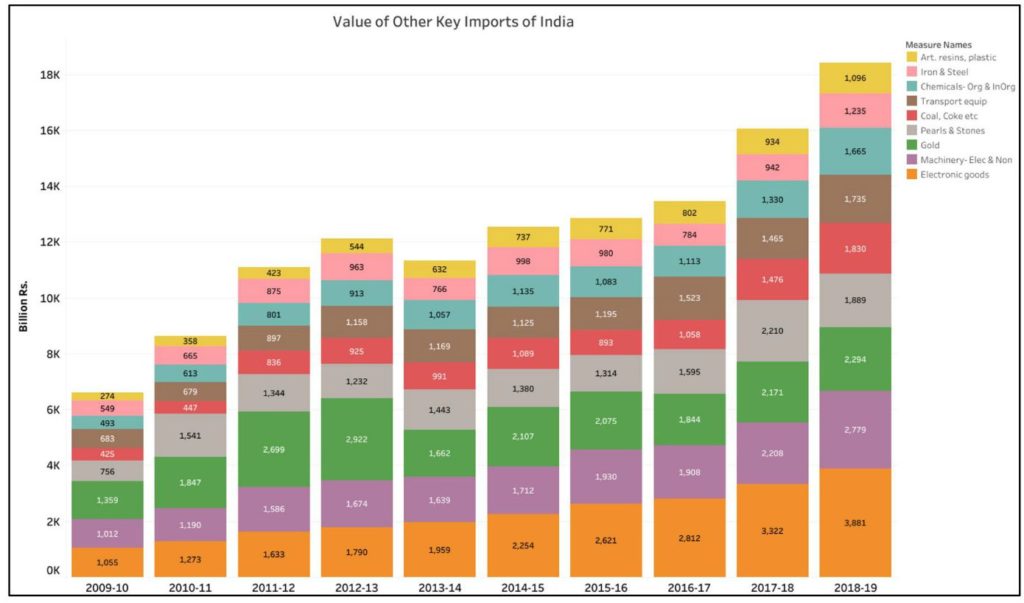
Electronic goods, Machinery and Gold among the other top imported commodities
Among the other key imports, the value of import of Electronic goods has increased by 3.6 times over the last decade. In 2009-10, the value was ₹ 1055 billion which increased to ₹ 3881 billion in 2018-19. Further, the value has consistently increased every year. Machinery (Electrical & Non-electrical) is not only the third highest valued import but also has consistently increased every year.
The next highest import commodity is Gold, which valued at ₹ 2294 billion in 2018-19 while it was ₹ 1358 billion in 2009-10. However, the highest value of Gold import was in 2012-13 at ₹ 2921 billion. The value of Gold imports has been inconsistent over the decade but has seen an increase since the last two years.
The value of import of Pearls, Precious and Non-Precious stones over the last 3 years has been higher than the earlier years of this decade. Coal, Transport Equipment, Iron & Steel, Chemicals, Resins & Plastics all have more than doubled up in the value of their respective imports over the decade.
Increase export of software products & other services can help bridge the balance of trade deficit.
As seen from the data, Petroleum (Crude & Products) occupy the major chunk of imports, averaging about a quarter of the total imports during major part of the last decade. It is used for direct consumption as well as for manufacture of other products. Being a key source of energy, it plays a critical role in India’s commercial activity. Unless alternate solutions are found & domestic production increased, the import of petroleum will continue to increase. Similarly, most of the other top imports – machinery, coal, transport equipment, chemicals, Iron & Steel, Resin etc. are used as raw materials for various industries aiding the commercial activity. A larger portion of imports of Gold & Precious/Semi-precious stones goes into export of finished Jewellery. Hence apart from the Electronic goods, most of the other top imports are used for further commercial activity.
A reduction in these imports, as indicated in the earlier story might not be feasible unless alternatives are found.
On the other hand, increasing the export of services may help in balancing the value of imports and thereby the trade deficit. However as highlighted in the story, most of the exports do not matchup to the higher value of imports.
Focusing on specific industries like Software, Engineering goods, Gems & Jewellery etc. where India has expertise could yield better results.
Featured Image: India’s trade balance

