Crimes against Women have continued to make headlines in our country for quite some time now. Public reaction to these crimes has varied between peaks and lows; peaking when a grotesque crime is brought to limelight by mainstream media and ebbing away after a period of sustained vociferous condemnation on social media platforms and the occasional candle light march.
[orc]In such a scenario, it would be prudent for us to look into the statistical data about Crimes against Women and sensitize ourselves about how we could deal with these issues.
The vast quantum of data that is available about crimes against women is an indicator in itself about the gravity of these crimes. And for that simple reason covering all the crimes against women in one article became unworkable. Hence in the first in a series of articles on crimes against women, we deal with ‘Rapes in India”.
A newspaper without the daily dose of rapes reported across the length and breadth of our country looks almost impossible and worse amongst all age groups. We have data for the number of Rape cases registered, convicted, persons arrested, persons convicted and much more for the years 2011, 2012 and 2013. Analysis of the data from these three years gives us invaluable insights into how this horrific crime has been dealt with, how the institutions have responded etc. This will also provide valuable insights to understand whether the Nirbhaya incident in December 2012 has changed anything on ground.
Did the Nirbhaya incident and the national outrage that followed have any impact on the institutional response in the following year? Has the attitude about registering and reporting of rape cases changed post December 2012? Let us take a look at the data and find out.
To understand the analysis and data, let us first familiarize ourselves with the parameters based on which data has been categorised
Cases Registered: The number of Rape cases registered in the given year.
Cases Convicted : The number of cases in which trial has been completed and those that resulted in conviction of the accused. These cases that completed trial wouldn’t have been necessarily registered in the same year only. This is because of the time taking nature of our judicial process.
Persons Arrested: The number of Persons arrested on the charge of Rape.
Persons Convicted: Persons who have undergone trials and have been finally adjudged guilty and convicted.
Pending Trials: The number of cases awaiting final judgement at the end of the particular year.
Cases registered per 1 lakh women: The number of Rape cases registered per 1 lakh women in that region/state. This is calculated taking into account the female population (of Census 2011) of the particular region/state.
Conviction Rate: This is the percentage of cases that resulted in conviction of the total cases that completed trial in that year. It is to be noted that it is a percentage of completed trials and not a percentage of cases registered in that particular year. A case registered in a particular year can complete trial in any year. This distinction is to be understood.
All India Numbers: 2011 to 2013
The following numbers are cumulative figures for the years 2011, 2012 and 2013.
| Type | Cases Registered | Cases convicted | Persons arrested | Persons Convicted | Pending trials (End of 2013) |
|---|---|---|---|---|---|
| States | 79706 | 11980 | 98,350 | 16457 | 93,356 |
| UTs | 3130 | 756 | 3760 | 980 | 2375 |
| Total (All-India) | 82836 | 12736 | 102110 | 17437 | 95731 |
It is worth noting that
- Eighty two thousand eight hundred and thirty six (82,836) Cases were registered over three years that is 2011, 2012 and 2013.
- Over the last three years, 75 cases of Rape were registered every day across the country.
- That is an average of 3 cases being registered every hour.
- On an average over the three years, 93 persons were arrested every day on charges of rape.
- That is an average of 4 persons being arrested every hour.
- There are Ninety Five thousand Seven hundred and Thirty one (95731) Pending trials as of 2013 in courts all over the country.
Year on Year Comparative Analysis
| Year | Cases registered | Cases Registered per day | Cases convicted | Cases Convicted per day | Persons arrested | Persons arrested per day | Cases registered per 1 lakh women |
|---|---|---|---|---|---|---|---|
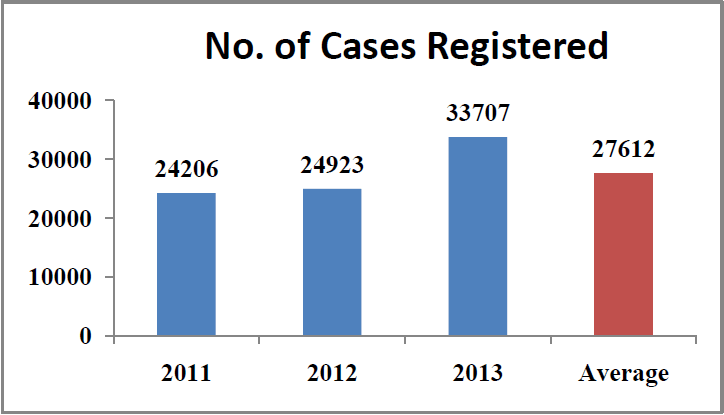
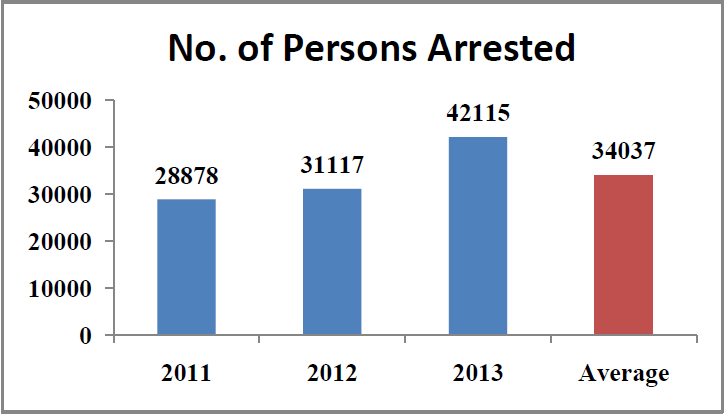
| 2011 | 24206 | 66 | 4072 | 11 | 28878 | 80 | 4 |
| 2012 | 24923 | 68 | 3563 | 9 | 31117 | 85 | 4 |
| 2013 | 33707 | 92 | 5101 | 14 | 42115 | 115 | 5 |
| Average | 27612 | 76 | 4245 | 12 | 34037 | 93 | 4 |
| Year | Persons convicted | Persons Convicted Per day | Conviction Rate in % | Pending trials |
|---|---|---|---|---|
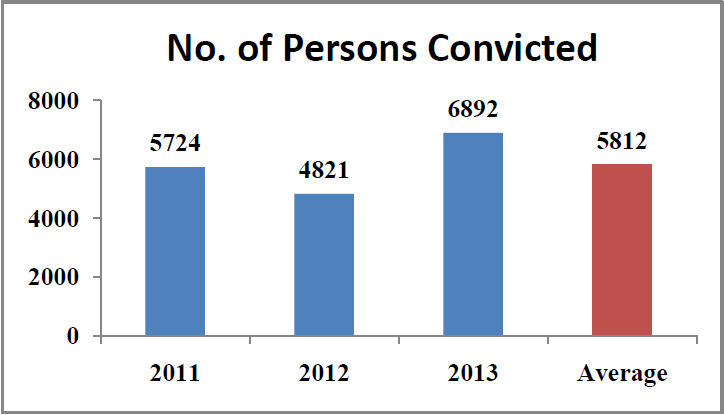
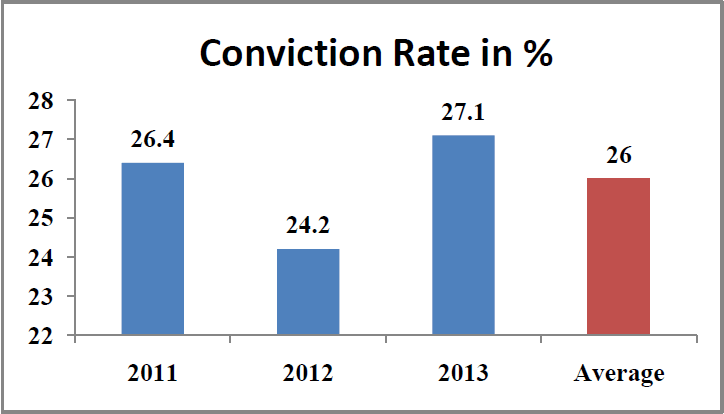
| 2011 | 5724 | 15 | 26.4 | 79476 |
| 2012 | 4821 | 13 | 24.2 | 86032 |
| 2013 | 6892 | 19 | 27.1 | 95731 |
| Average | 5812 | 16 | 26 | — |
It is worth noting that
- From the year 2011 to 2012 the number of cases registered increased by 3%. But from 2012 to 2013 the number of cases saw a big jump of increase by 35%. The public outrage that followed the Nirbhaya incident seems to have had at least one concrete positive outcome, i.e. increased reporting of crimes.
- The cases convicted over the years 2011 to 2012 saw a decline of 12.5% even though the number of cases saw a marginal increase over the two years. Then again from 2012 to 2013 the number of cases convicted rose by 43%.
- The number of persons arrested from 2011 to 2012 rose by 7.75% and following the trend of substantial rise of figures from 2012 to 2013, number of persons arrested increased by 35% from 2012 to 2013
- The number of persons convicted declined by 15% from 2011 to 2012 and rose significantly by 43% from 2012 to 2013
- The highest conviction rate in the three years is observed for 2013 which is 12% over the 2012 conviction rate.
- Pending Trials have only increased year by year. Despite setting up Fast track courts after the Nirbhaya incident, the pending trials have not shown any decline from 2012 to 2013.
- Number of cases registered per 1 lakh women remained constant at around 4 cases for 2011 and 2012 and it went up to 5 cases per 1 lakh women which again clearly shows the trend of increased reporting of crimes.
- On an average 93 persons were arrested per day over the period of 2011 to 2013.
- With respect to trials completed in a year , 16 persons were convicted every day on an average for the years 2011-2013
(Note: The persons convicted in a year might not necessarily have been arrested in the same year, conviction results from trials completed in a particular year)

In Focus – Delhi
In the recent years, Delhi has earned itself the reputation of being the ‘Rape Capital’. While this claim cannot be completely refuted, the data does not suggest otherwise.
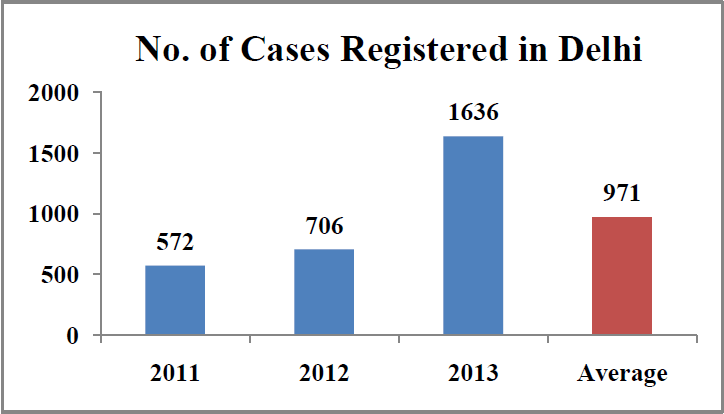
Cases Registered
| Year | 2011 | 2012 | 2013 | Total | Average |
|---|---|---|---|---|---|
| Cases Registered | 572 | 706 | 1636 | 2914 | 971 |
| Change from previous year | – | 23.40% | 131% | – | – |
| Deviation from Average | -41% | -27% | 68% | – | – |
(Deviation from Average: This is the percentage by which a certain value varies with respect to its corresponding average. If the value is greater than the average then it results in a positive deviation and if the value is lesser than the average then it results in negative deviation)
It is worth noting that
- On an average 3 cases of rape were registered per day in Delhi from 2011 to 2013.
- Post the Nirbhaya incident, the number cases of rape reported in Delhi in 2013 more than doubled from the previous year i.e. 2012.
- The total number of cases registered in Delhi over the years 2011, 2012 and 2013 are 3.6% of the total number of cases registered across India while the female population of Delhi is a mere 1.33% of the total female population in India.
- The number of Registered Rape cases in Delhi increased slightly from 2011 to 2012 by 23%. The effect of Nirbhaya incident is clearly visible from the change in cases registered in 2013 compared to 2012. The number of cases registered in 2013 increased by 131% compared to 2012.
- The number of registered cases in 2011 and 2012 were much lesser than the average number of cases registered over the three years .The number of cases registered in 2013 is 68% more than the average cases registered in those years.
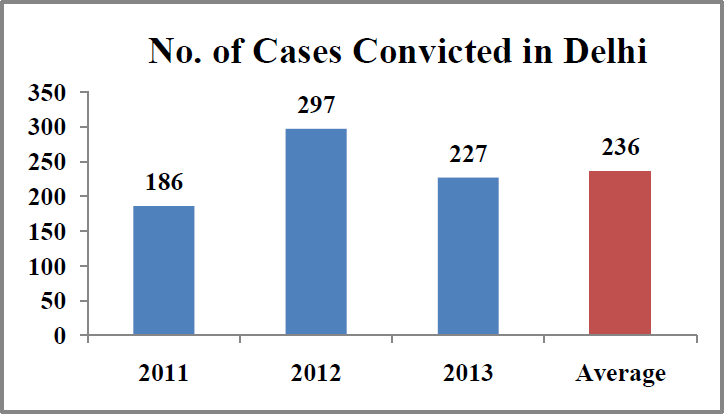
Cases Convicted
| Year | 2011 | 2012 | 2013 | Total | Average |
|---|---|---|---|---|---|
| Cases Convicted | 186 | 297 | 227 | 710 | 236 |
| Change from previous year | – | 60% | -23% | – | – |
| Deviation from Average | -21% | 25% | -4% | – | – |
- Convicted cases that increased by 60% from 2011 to 2012 dropped by 23% from 2012 to 2013. 2013’s Convicted cases is also lesser than the average convicted cases by 4%.
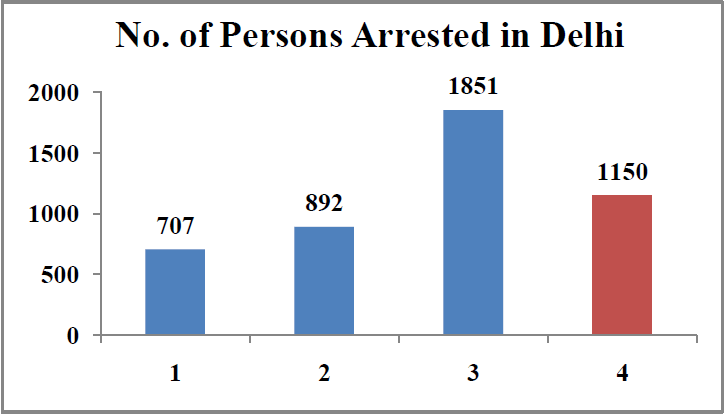
Persons Arrested
| Year | 2011 | 2012 | 2013 | Total | Average |
|---|---|---|---|---|---|
| Persons Arrested | 707 | 892 | 1851 | 3450 | 1150 |
| Change from previous year | – | 26% | 107% | – | – |
| Deviation from average | -38% | 22.40% | 60% | – | – |
It is worth noting that
- The number of persons arrested per day rose by about 26% in 2012, but more than doubled in 2013.
- Over the three years, on an average 3 persons were arrested everyday on the charge of Rape.
- The number of persons arrested in 2012 and 2013 is lesser than the average number of persons arrested in the three years, but the number of persons arrested in 2013 is 60% more than the average number of persons arrested.
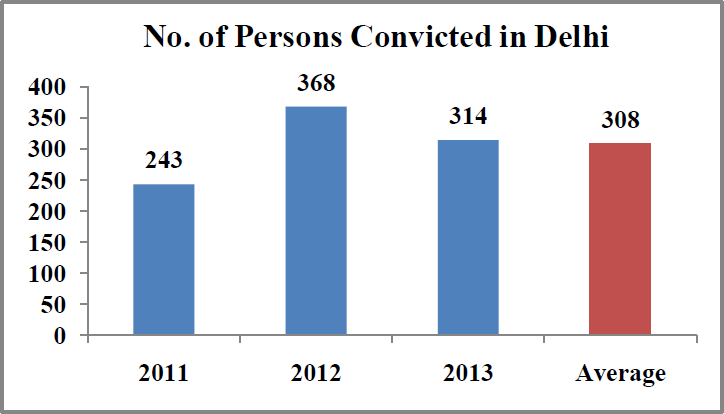
Persons Convicted
| Year | 2011 | 2012 | 2013 | Total | Average |
|---|---|---|---|---|---|
| Persons Convicted | 243 | 368 | 314 | 925 | 308 |
| Change from previous year | – | 51% | -14% | – | – |
| Deviation from average | -21% | 19.40% | 2% | – | – |
It is worth noting that
- Number of persons convicted increased from 2011 to 2012 by 51% and declined by 14% from 2012 to 2013.
- The number of persons convicted in 2011 is lesser than the average number of persons convicted over the three years but the numbers of persons convicted in 2012 and 2013 is higher than the average number of persons convicted.
Pending Trials
| Year | 2011 | 2012 | 2013 |
|---|---|---|---|
| Pending Trials | 1439 | 1404 | 2154 |
Number of pending trials decreased by 2% from 2011 to 2012, but increased by a massive 53% cases from 2012 to 2013. This can be explained by the fact that the number of cases registered increased by more than two times from 2012 to 2013. But then at the same time Government set up a fast track court to specifically deal with sexual offences in January 2013 itself and yet this doesn’t have seemed to have had any substantial impact on the pending trials.
Cases Registered Per 1 Lakh Women
| Year | 2011 | 2012 | 2013 | Average |
|---|---|---|---|---|
| Cases registered per 1 lakh women | 7 | 9 | 21 | 12 |
| Change from previous year | – | 28.50% | 133.30% | – |
| Deviation From Average | -41% | -25% | 75% | – |
It is worth noting that
- From 2011 to 2012 the number of cases registered per 1 lakh women increased by 28.5% and from 2012 to 2013 it went up by 133%.
- When compared to the average number of cases registered per 1 lakh women over the three years, the 2013 figure is 75% more. With the analysis of each parameter, the fact that reporting of crimes increased substantially post the Nirbhaya tragedy is reinforced.
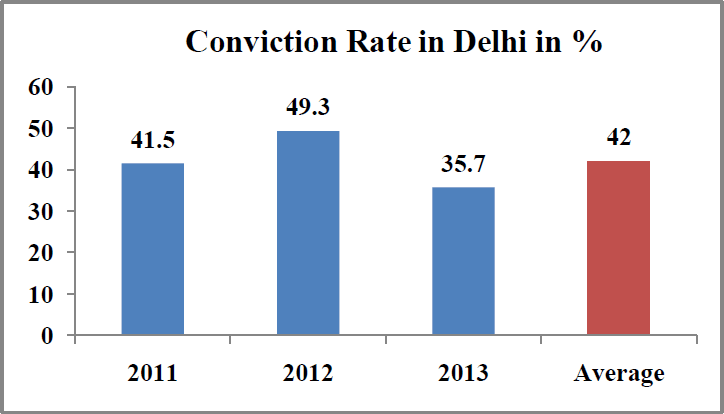
Conviction Rate
| Year | 2011 | 2012 | 2013 | Case conviction Rate for the three years |
|---|---|---|---|---|
| Case Conviction Rate (in %) | 41.5 | 49.3 | 35.7 | 42 |
It is worth noting that
- Case conviction rate increased from 2011 to 2012 and then again declined from 2012 to 2013.
- For the three years on an average, 42% of the cases that completed trials resulted in conviction in the case of Delhi.
- Conviction rate in Delhi rose by 18% from 2011 to 2012, but it declined by 27% from 2012 to 2013.
What do the numbers tell us?
The following trends were observed from analysis of the All India data and the Delhi data with respect to cases related to Rape
- The national debate that ensued after the Nirbhaya incident did do a great deal of good. Apart from raising relevant questions and exposing the loop holes in our institutions, what it also did was to give enough confidence to women to report cases of rape and instil a sense of responsibility in the the police register cases.
- This impact wasn’t localised to the states around Delhi, but it was witnessed all over the country.
- Cases registered with for rape across India increased from 2011 to 2012 by 3% but they increased by 35% from 2012 to 2013.
- In Delhi, the cases registered for rape increased by 23% from 2011 to 2012, but increased by a whopping 131% from 2012 to 2013.
- Nationally, cases registered for 1 lakh women was almost constant at 4 in 2011 and 2012, but in 2013 it went up to 5. This increase of 1 case per 1 lakh women becomes significant when we take the entire population into account.
- Government did take note and paid increased attention to Rape cases. For instance, Persons arrested increased from 2011 to 2012 by 6.25% but this increased by 35.2% from 2012 to 2013.
- The number of persons arrested in Delhi increased by 26% from 2011 to 2012 but from 2012 to 2013 it increased by 107%
In the articles to follow, we will look at detailed numbers from different regions of the country & also the states. We will also look at the initiatives by the government to deal with crimes against women.
Data Sources
Answer to Unstarred Question No. 4964, Ministry of Home Affairs
http://www.censusindia.gov.in/
Featured image: Ramesh Lalwani | Flickr
In part 2 of the series on Rape cases in India from 2011-13, we look at different regions of the country and compare trends. Read it here


11 Comments
Hello Sasi Priya, What a fab job you have done to compile all this data and put this in perspective. As you pointed the biggest outcome has been the increased reportage of rape incidents. The pending trials is a tad disappointing.
As someone who is interested in data, I believe that it should lead us to more questioning rather than take as an absolute. For eg, just looking at all this data, i am tempted to ask myself, about the class of women who are reporting rapes and the class of people being arrested. Is it the middle class or economically lower class women living in jhuggis etc that report rape? Similarly for the people arrested? As we know, the big fish always escape and it is easy to arrest those in the lower economic strata.
One of the issues with the entire rape/ violence against women discourse is that it is a problem of the great unwashed. While in reality we know it isn’t the case.
But, getting more granular data on the profiles, economic classes is a very difficult task I understand. Again, congrats on this awesome job. And thank you for writing this.
Yes Bhanu. This particular data was gathered from the Lok Sabha question & answers. The granular data would be helpful most definitely. But am afraid we might have to get that from individual states by using RTI. Data on atrocities against SCs/STs might be available with NCRB. But the entire data will only be available with the state home department or the police.
Great work. I have seen people rant about security in India after the recent ban on BBC documentary. It frustrated me as nobody was giving any facts to support what they are saying. I wondered if there is a place where data is provided to understand the reality and this post is the best I have seen. Thanks a lot for the information
Thank you Kishore
What about False Rape charges, What shd we chop of in a girl.
Pingback: Do Indian Women Feel Safe After 3 Years Of Brutal Nirbhaya Case?
Pingback: Let’s talk about rape – shittysunshine
Pingback: India Urgently Needs To Resolve Its Rape Issue | My City Woman!
Pingback: India Urgently Needs To Resolve Its Rape Issue | My City Woman!
Pingback: NCRB releases 2016 crime report: Why we need to steer clear of ‘crime capital,’ ‘rape capital’ labels in headlines – News Paper
Pingback: Is The NCRB Delaying The Release Of Its Reports? – TopTea