[orc]We looked at the all India numbers & also the numbers for Delhi in Part 1. In this article, we compare the various regions of the country for the parameters discussed in the previous article.
Region Wise Analysis
For this analysis, the country is divided into various regions based on geographical location. States have been grouped into regions based on their geographical location.
| Region | State/UT |
|---|---|
| North | Haryana, Himachal Pradesh, Jammu & Kashmir, Punjab, Uttar Pradesh, Uttarakhand |
| South | Andhra Pradesh (Now Andhra Pradesh & Telangana), Karnataka, Kerala, Tamil Nadu |
| East | Bihar, Jharkhand, Odisha, West Bengal |
| West | Goa, Gujarat, Maharashtra, Rajasthan |
| North East | Arunachal Pradesh, Assam, Manipur, Meghalaya, Mizoram, Nagaland, Sikkim, Tripura |
| Central | Chhattisgarh, Madhya Pradesh |
| UT | A&N Islands, Chandigarh, D&N Haveli, Daman & Diu, Delhi, Lakshadweep, Puducherry |
Note: All the figures discussed henceforth are cumulative figures of 2011, 2012 and 2013 unless otherwise mentioned.
*Telangana is not mentioned/considered as a separate state for this analysis since the data is available only upto 2013 and that data is not maintained separately for the current day Andhra Pradesh & Telangana. The data for Andhra Pradesh in this analysis also includes the areas of the current Telangana State.
Cases Registered & Convicted
We hear frequently that many rapes go unreported due to the societal pressure & stigma involved in such cases. This parameter gives us an idea about people’s perception and willingness to report a Rape. The convicted cases number is important to understand how the investigative & prosecution machinery works and how much such cases actually result in conviction. The regional variations in such a figure could also prompt us to do a deeper analysis to find out the underlying reasons. It should also be noted that cases registered in a particular year may not result in a conviction that year itself. The number of cases convicted is out of the total number of cases that completed trial.
| Rank | Region | Total Cases Registered (2011-13) | Total Cases Convicted (2011-13) |
|---|---|---|---|
| 1 | East | 16285 | 1871 |
| 2 | West | 15551 | 1367 |
| 3 | Central | 14633 | 3256 |
| 4 | North | 13538 | 3744 |
| 5 | South | 12414 | 998 |
| 6 | North East | 7285 | 744 |
| 7 | UTs | 3130 | 756 |
| 8 | All India | 82836 | 12736 |
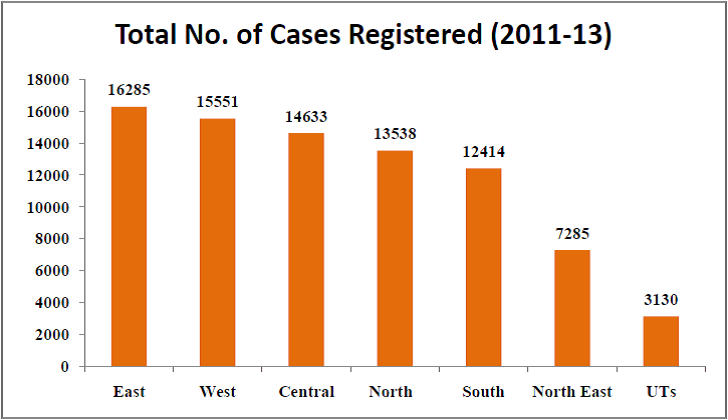

It is worth noting that
- Highest numbers of cases have been registered in the East of the country.
- North Eastern States and UT’s have the lowest number of cases registered.
- Though North ranks fourth in terms of number of cases registered, it stands first in terms of number of convicted cases.
- South though ranked 5th in number of cases registered fared dismally when it comes to conviction of cases.
- North ranks just above South with 8% more cases registered, but has 73% more cases convicted than the South.
- It is to be noted that, of the total number of cases registered in UTs (3130), Delhi alone accounts for 2914, which is a whopping 93% of all the cases registered in UTs.
Persons Arrested & Convicted
Persons Arrested is the number of people arrested in the three years on charges of rape while Persons Convicted is the number of persons convicted on charges of rape (found guilty).
| Rank | Region | Persons Arrested (2011-13) | Persons Convicted (2011-13) |
|---|---|---|---|
| 1 | North | 20939 | 5326 |
| 2 | Central | 19402 | 4096 |
| 3 | West | 18092 | 2095 |
| 4 | East | 17818 | 2347 |
| 5 | South | 15159 | 1762 |
| 6 | North East | 6940 | 831 |
| 7 | UTs | 3760 | 980 |
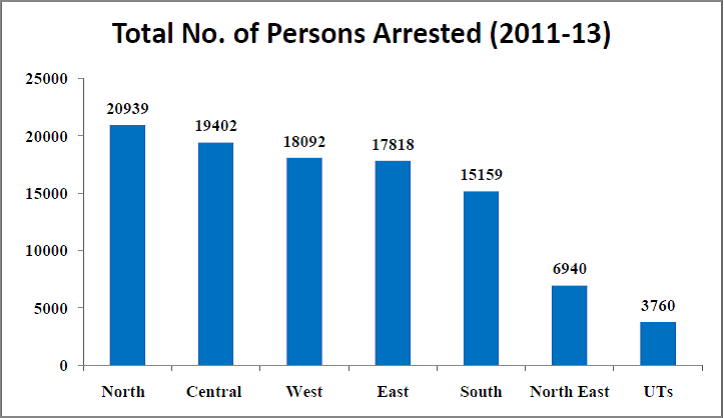
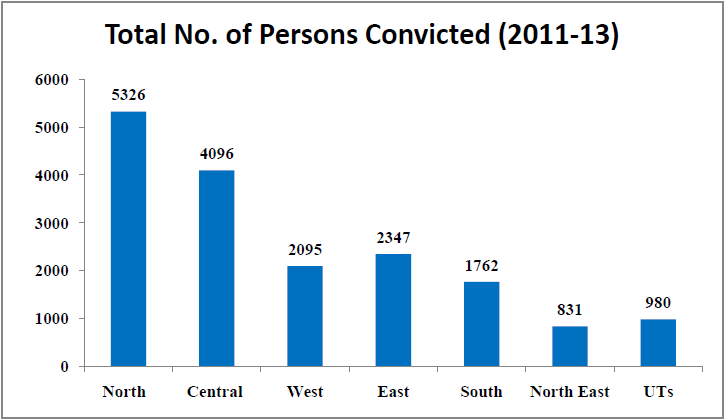
It is worth noting that
- Highest number of Persons were arrested and convicted in the North though the highest number of cases registered was not in the North.
- Again, North East & UTs are towards the bottom when it comes to both these parameters.
- Central India comprises of only Madhya Pradesh and Chhattisgarh, but has an alarmingly high number of cases registered, persons arrested & persons convicted. This is something that needs deeper analysis.
- Of the 3760 persons arrested in UTs, Delhi alone accounts for 3450 persons or 91%. Delhi’s contribution to persons convicted in UTs is 94%. This is in line with a large number of cases registered in Delhi.
Pending Trials
Indian judicial system is infamous for its long and tiring judicial process, and in crimes such as rape this wait can be all the more dreadful. A major deterrent to these crimes is swift justice, and the pending trials are a good way to understand that.
| Rank | Region | Pending Trials at the end of 2013 |
|---|---|---|
| 1 | East | 27539 |
| 2 | West | 23304 |
| 3 | Central | 11737 |
| 4 | South | 13489 |
| 5 | North | 8590 |
| 6 | North East | 8697 |
| 7 | UTs | 2375 |

It is worth noting that
- Highest numbers of cases are pending in the East.
- Central India accounting for about 12% of the pending trials is worrisome.
- North & UTs have the least number of pending trials.
Cases Registered Per One Lakh Women
This is an important parameter as it helps us normalize the cases registered over the female population of a region. It tells us about the incidence of Rape Cases registered.
| Rank | Region | Cases registered per 1 lakh women (2011-13) |
|---|---|---|
| 1 | UTs | 33 |
| 2 | North East | 32 |
| 3 | Central | 30 |
| 4 | West | 13 |
| 5 | East | 12 |
| 6 | North | 10 |
| 7 | South | 9 |
| 8 | All India | 14 |
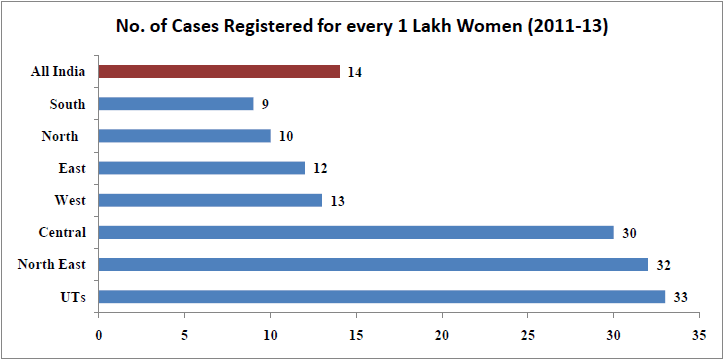
It is worth noting that
- The number of cases registered is lowest for the UTs, but the cases registered per 1 lakh women is the highest which clearly means that the UTs have the highest incidence of reported Rape cases, same is the case for North East which comes a close second
- Keeping up with popular perception that the southern states are relatively safer, they have lower incidences of rapes. Southern region ranks the last with least incidence of reported cases.
- Like mentioned earlier Central India comprises of only two states Madhya Pradesh and Chhattisgarh but the incidence of rapes in this region is alarmingly high.
Top 10 States with Highest Incidence of Registered Rape Cases
Here is the list of top 10 states with highest incidence of Registered Rape cases.
| Rank | Region | State/UT | No. of Registered Cases per 1 lakh women(2011-2013) |
|---|---|---|---|
| 1 | North East | Mizoram | 49 |
| 2 | North East | Tripura | 37 |
| 3 | UT | Delhi | 37 |
| 4 | North East | Assam | 35 |
| 5 | North East | Meghalaya | 32 |
| 6 | North East | Sikkim | 32 |
| 7 | Central | Madhya Pradesh | 31 |
| 8 | UT | Andaman & Nicobar Islands | 29 |
| 9 | Central | Chhattisgarh | 27 |
| 10 | North East | Arunachal Pradesh | 24 |
It is worth noting that
- Mizoram has the highest incidence of Rape in our country, and the number is more than three times the national average (of 14).
- Six of the seven North Eastern states figure in the top ten.
- The much talked about rape capital of India –Delhi is in the second place.
- Only the States/UTs from three regions (North East, Central & UTs) comprise the top 10.
- How little we know of the North Eastern states is again evident from these figures. Even though the incidence of rapes is very high in the North East, the rest of the country hardly gets to hear of it. Same is the case with Andaman and Nicobar Islands; one hardly gets to hear any news about it on National television, let alone about crimes against women.
Top 10 States with Least Incidence of Registered Rape Cases
Here is the list of top 10 states with least incidence of Registered Rape cases.
| Rank | Region | State/UT | No. of Registered Cases per 1 lakh women(2011-2013) |
|---|---|---|---|
| 1 | UT | Puducherry | 5 |
| 2 | West | Gujarat | 5 |
| 3 | UT | Lakshadweep | 6 |
| 4 | South | Tamil Nadu | 6 |
| 5 | East | Bihar | 6 |
| 6 | North | Uttar Pradesh | 7 |
| 7 | North East | Nagaland | 7 |
| 8 | South | Karnataka | 7 |
| 9 | UT | Dadra & Nagar Haveli | 8 |
| 10 | North | Uttarakhand | 10 |
It is worth noting that
- Two of the four Southern States figure in the states with least incidence of Rape cases registered.
- Least incidence of Rape is observed in the UT of Puducherry with only 5 cases registered per 1 lakh women which is almost 1/3rd of the national average.
- Nagaland is the only North Eastern state to figure in this list.
Conviction Rate in Percentage (%)
Conviction rate is the percentage (%) of cases that resulted in conviction out those that completed trail in those years. In simpler words, Conviction rate is the number of cases in which persons were convicted for every 100 cases that completed trial.
| Year | 2011 | 2012 | 2013 | Average for three years (2011-2013) |
|---|---|---|---|---|
| States | 25.9 | 23.1 | 26.8 | 25 |
| UTs | 41.1 | 48.2 | 35.5 | 41 |
| All India | 26.4 | 24.2 | 27.1 | 26 |
- In the three years (2011, 2012 & 2013), for every 100 cases that completed trial, only 26 cases lead to a conviction.
- In UTs this rate rose by 17% from 2011 to 2012 but declined by 26% from 2012 to 2013.
- In states, the conviction rate witnessed a steady growth.
Region Wise Conviction Rate (%)
| Rank | Region | Conviction Rate (2011-13) in % |
|---|---|---|
| 1 | UT | 42 |
| 2 | North | 40 |
| 3 | North East | 25 |
| 4 | Central | 24 |
| 5 | West | 22 |
| 6 | East | 22 |
| 7 | South | 16 |
| 8 | All India | 26 |
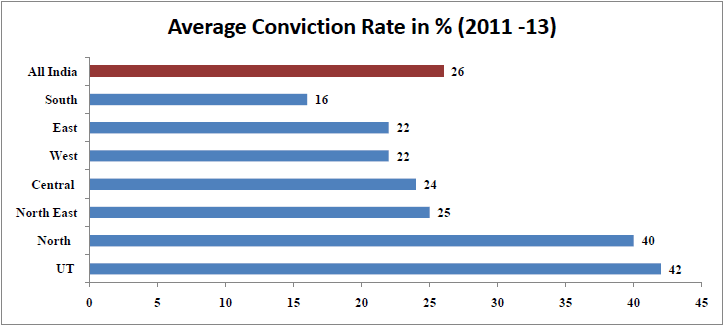
It is worth noting that
- It is to be noted that case conviction rates are dependent on the number of cases that completed trial i.e. fewer trails completed might give us a higher conviction rate.
- UTs had the highest percentage of convicted cases for the cases that completed trial way higher than the national average of 26.
- Highest Conviction Rate of 82% is observed in Nagaland in the North East region. In fact, the North East region states have high conviction rates compared to states from other regions.
- Only 6 cases out of 100 cases that completed trial led to conviction in the case of Jammu and Kashmir which is the least in the entire country.
- Southern states show a trend of having low conviction rates. In fact all of them have a conviction rate lower than the national conviction rate.
- Madhya Pradesh which figures in the top ten states for rapes registered per 1 lakh women has a conviction rate of 22%, lower than the national average.
- The AFSPA troubled Manipur state completed 1 trial in 2011 which led to conviction and hence the conviction rate of 100%.
What more needs to be done?
- Analysis of the data brings to our notice the high incidences of Rape cases in the North East. This needs urgent attention of the government and has to be brought to the notice of the entire nation. Rapes in North East need to be stressed upon just as much as Rapes in any other part of India are stressed. This assumes more importance in the light of the data suggesting that more discussion about a topic leads to sensitisation about the topic which in the end leads to a victim friendly environment, especially in a situation where victims are often treated by the society as abettors of the crime itself.
- Even after considering the factor of increased reporting of crimes, the number of pending trials is still quite high. This should ideally not be so, given that many state governments have setup Fast track courts. Efficiency and quick action is the need of the hour.
- The common perception that most of the rapes actually go unreported is supported by the data that, each year 14 cases per one lakh women are registered all over India on an average. This is due to the fact that many independent studies highlight the non-reporting of cases especially in cases where the victim is from a marginalized community. Gender sensitisation and sustained dialogue have proven to be an effective cure to improve this, so this should be taken up with more vigour.
The dialogue that the Nirbhaya incident sparked off should be sustained by one and all. It is the efforts of ordinary people who actively engaged in debates, expressed their discontent that seems to have had some impact. Dialogue and Awareness are the weapons to tackle this menace.
Data Sources
Answer to Unstarred Question No. 4964, Ministry of Home Affairs, http://www.censusindia.gov.in/
Featured image: Ramesh Lawani | Flickr
Part-3 analyses the correlation between three different parameters, Sex Ratio, Literacy Rate and Rape cases registered per lakh women. National average for each of the parameters is used as a baseline to define ‘high’ and ‘low’ nature of the parameters


8 Comments
Hi Sasi priya, Fab job again.
Do you have data disaggregated by states? I sometimes feel that grouping by regions might skew the trends. I say this coz I have been looking at data on women’s representation in elected bodies and find that Southern states are quite varied.
Your point about NE sates is spot on. Mizoram has one of the best litercay rates in India and tops in the NE, but violence and crimes against women is a huge problem there. I recently discovered this and was quite shocked. Read this paper when you have time
http://www.academia.edu/7671229/Emergence_of_Women_from_Private_to_Public_A_Narrative_of_Power_Politics_from_Mizoram_1
North east also has a lot of military and AFSPA related rape abuse. But I doubt if it is in official records. Worth exploring that. Also, worth looking at is rape cases in conflict zones, with military presence..JK, Manipur etc.
But for a cross-country perspective, this is really good… Congrats!
We do have state wise granular data and we will write more on individual states. But what is glaring is that conflict ridden states often have reported greater numbers. Just Madhya Pradesh & Chattisgarh have reported close to 18% of the total cases in the last 3 years.
Bhanupriya Rao , Thank you so much for your kind words ma’am! It is very encouraging to get such positive reviews 🙂
We definitely intend to do state wise analysis, there is just many trends and so much data varying from state to state , putting them all in piece was simply not feasible . Also like you mentioned I’ve been looking to see if there’s any correlation between sex ratio and literacy rate as well..
Will also try to explore the other things you’ve mentioned and yes I will go through the link you’ve given as well 🙂
Dear Sasi Priya,
The above exhaustive statistical analysis is very commendable for you have given factual information on the condition of India today. However is there any information on the convicted persons and are they carrying out their sentence or are they still appealing for Presidential Pardon, why should they even be allowed such an option for such crimes against women.
Very good data analysis. Better job than news websites
Excellent analysis… Although you could go further by providing a heat-map of state-wise statistics… There has been a lot of emphasis on total number of registered cases (and its break-up by state and region), but I believe “No. of Registered Cases per 1 lakh women” is more relevant….
Further, a ratio similar to “No. of arrests & convictions”/”No. of registered cases” might be an interesting statistic to be tracked by region/state (we should probably take cumulative numbers because of the lag between a case getting registered and the arrest/conviction)….
I am not sure why you had to limit your research to cases from 2011 to 2013… Having more data points, probably running back to a decade might better indicate trends… (You could explore the RTI option if the data is not publicly available)…
Anyway, this is a very good analysis and I wish more people wrote such articles based on thorough research and verifiable numbers…
Thanks for writing in Swaroop. State wise analysis will follow. To answer your queries
1. The registered cases was emphasized to understand the change if any in reporting the rape cases post the delhi incident.
2. Number of convictions cannot be directly linked to number of cases registered in a particular year since those cases may or may not end trial in the same year. Unless we have case wise details, that ratio will become difficult. Else, we have to take a 15-20 year period for analysis.
3. We extensively use RTI as a part of our work. Here, we could get comprehensive data for only these 3 years. We are planning to do a detailed database of these figures dating back to a decade or so.
Hi Sasi, hats off to your statistic analysis and display in detail. As swaroop suggested a detail analysis on previous analysis will give some ideas on tend, with which we can come to pull out the trending cause.
It would be appreciable if we able to analyse on the accused persons status, his background, their mentality and situation at which they intend to indulge in such abusing activities.. So that it helps us to have an idea on to correct that mentality of persons and to take some actions accordingly to avoid future incidents.